Analysis: Bitcoin “Reset” Complete as Key Trend Line Reappears
Data compiled by the on-chain analytics platform CryptoQuant reveals that BTC/USD has entered a fresh battle with its 20-month simple moving average (SMA). This closely monitored moving average, which stood at $87,165 as of mid-October, forms the foundation around which the popular Bollinger Bands metric is constructed. In turn, the Bollinger Bands provide the empirical basis for CryptoQuant’s proprietary market cycle signals tool, an analytical instrument designed to pinpoint Bitcoin’s exact position within its broader multi-year market cycle.
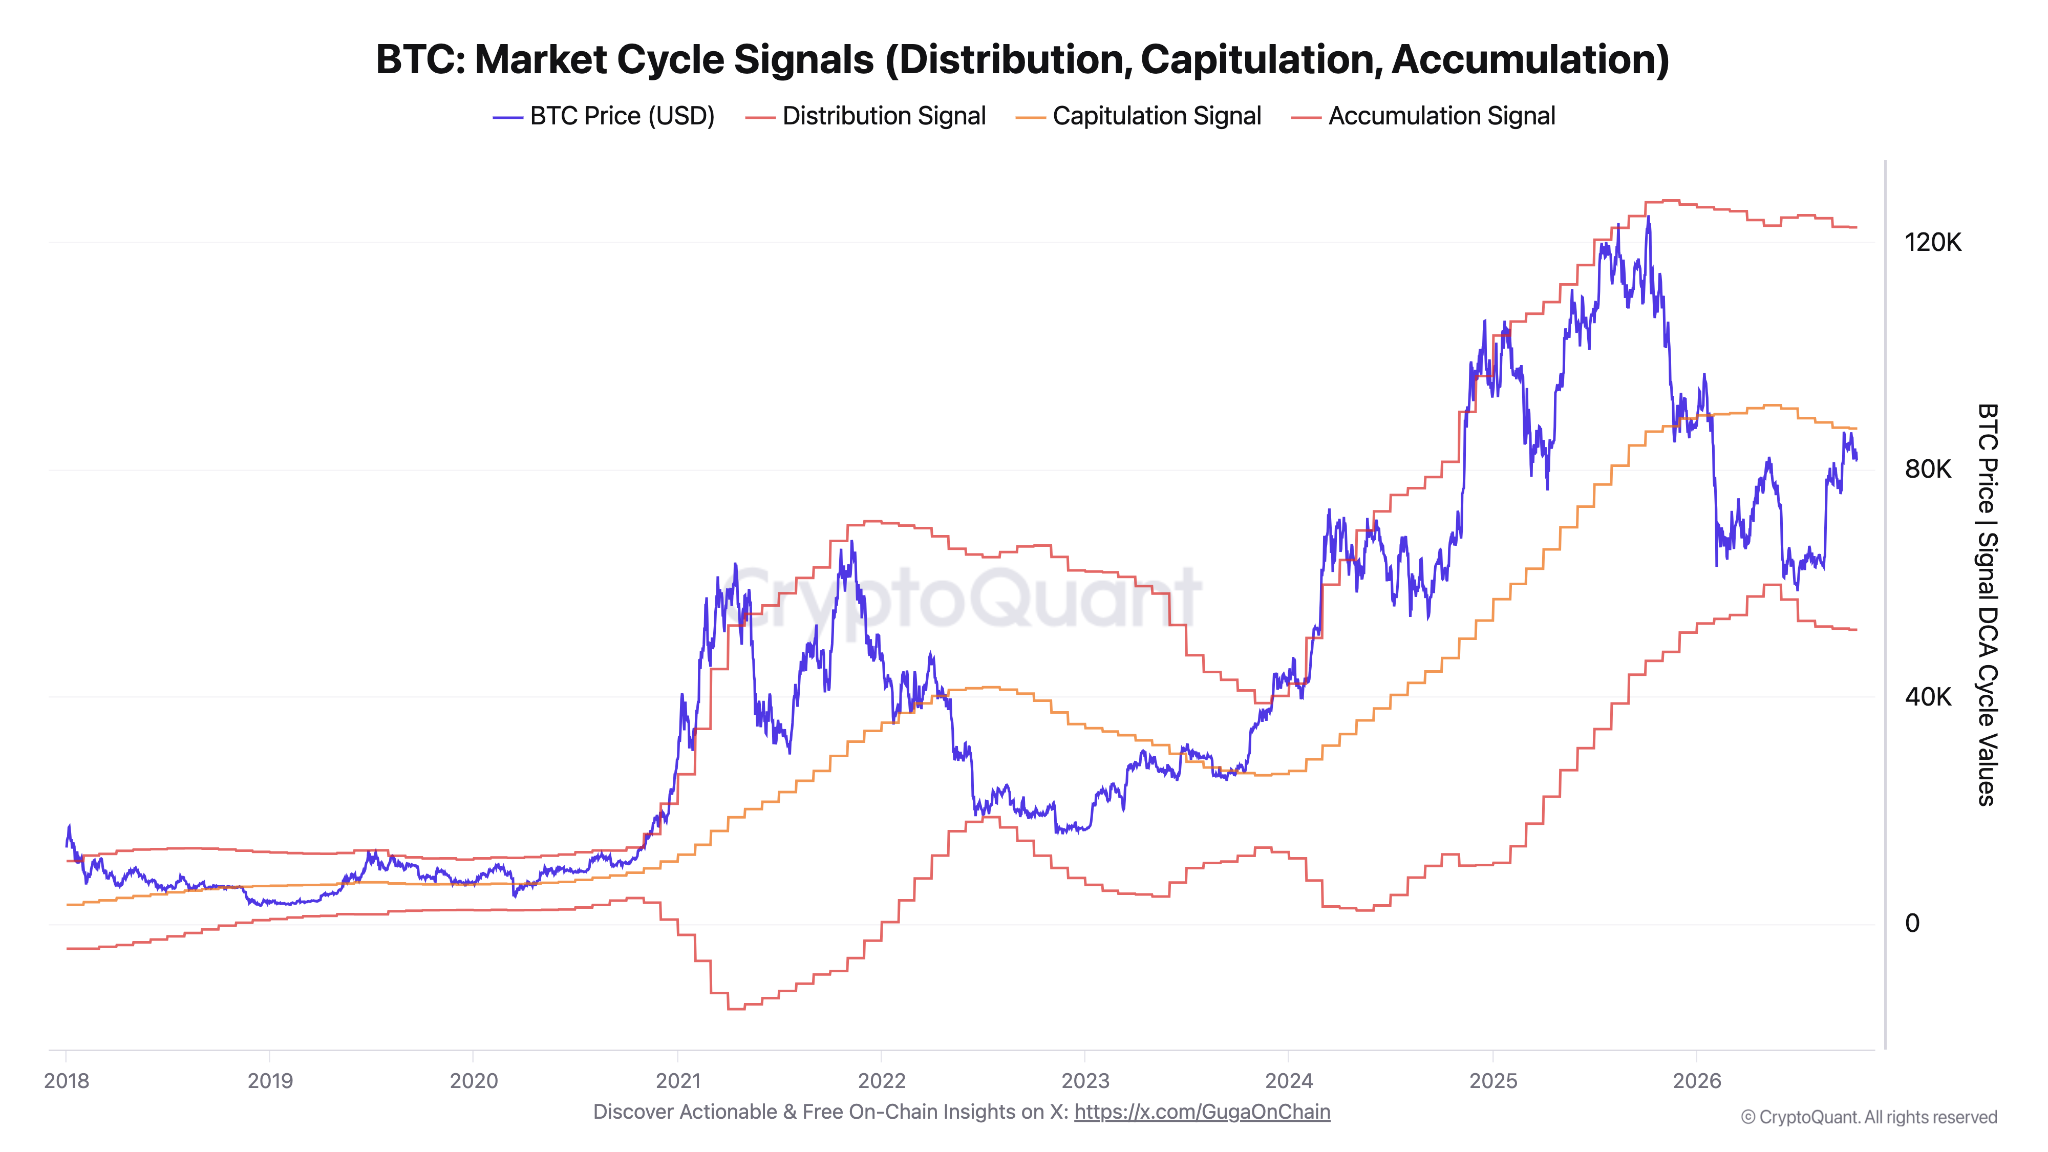
The Bollinger Bands framework utilizes standard deviation to project an upper band and a lower band around the central 20-month SMA. Currently, these technical boundaries sit at $121,640 and $52,694, respectively. Within this framework, CryptoQuant’s indicator classifies the geographical price zone nestled between the lower band and the 20-month SMA as an "accumulation base," while the moving average itself is designated as an "inflection frontier." Historically, this specific frontier has acted as a notable point of investor capitulation whenever the market price has broken below it from above, most recently during a sharp downward correction in December 2025.

With Bitcoin now preparing to challenge this historical capitulation zone from underneath, market history indicates that a successful, sustained breakout has frequently preceded powerful surges into unprecedented cycle highs. Reflecting on this structural recovery, CryptoQuant contributor GugaOnChain noted in a recent blog post that the market has officially concluded its protracted "reset" phase, occurring just over a year after Bitcoin notched its previous all-time high of $124,709 on October 6, 2025.
While the Bollinger Bands metric is inherently structural and not strictly designed to generate automated buy or sell triggers, CryptoQuant’s market cycle signals interpret the behavioral patterns of institutional and experienced market participants—frequently termed "smart money." According to the analytics model, these sophisticated entities typically begin systematically taking profits once BTC/USD ascends to touch its upper band. Although the upper band currently sits just below Bitcoin’s most recent all-time high of $126,200 recorded in October 2025, on-chain projections suggest that any upcoming bullish continuation has the structural momentum to push significantly beyond those historical ceilings.
Addressing prevailing market sentiment, GugaOnChain pointed out a notable psychological disconnect between retail investors and macroeconomic reality. While retail traders often succumb to fear during periods of localized consolidation—mistaking temporary support levels like the $82,442 threshold for a definitive market top—the underlying on-chain indicators reveal a market that is merely entering a new phase of expansion. This particular price zone has functioned as an active support area amidst broader macroeconomic pressures, including recent reactions to domestic inflation data such as the United States Producer Price Index (PPI) gains.
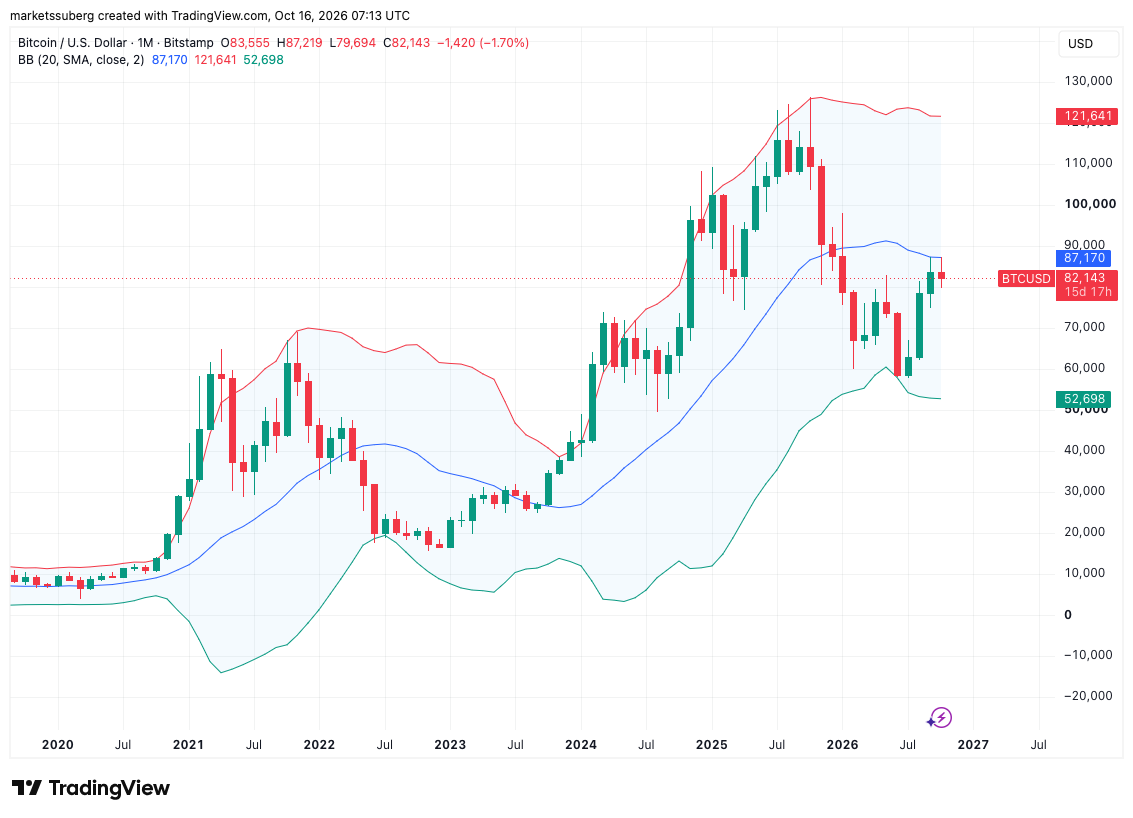
Adding further technical weight to the situation, the 20-month SMA currently shares significant confluence with Bitcoin’s opening price level for 2026 at $87,490. This overlapping convergence effectively amplifies its strength as an immediate technical resistance barrier. Market reports have similarly highlighted substantial walls of ask liquidity clustered tightly around these price levels across various major exchange order books, underscoring the necessity of high-volume buying pressure to decisively clear the zone.
Onchain data shows entrenching Bitcoin bull market
Despite the complexities of navigating ongoing macroeconomic headwinds and shifting risk-asset appetites, CryptoQuant maintains a broadly optimistic macro outlook regarding the development of Bitcoin’s current bull market structure. Analysts across the digital asset research community have increasingly pointed to converging network metrics that signal underlying network health and robust long-term holder accumulation, offering substantive reasons for bullish momentum to reassert itself as the fourth quarter progresses.
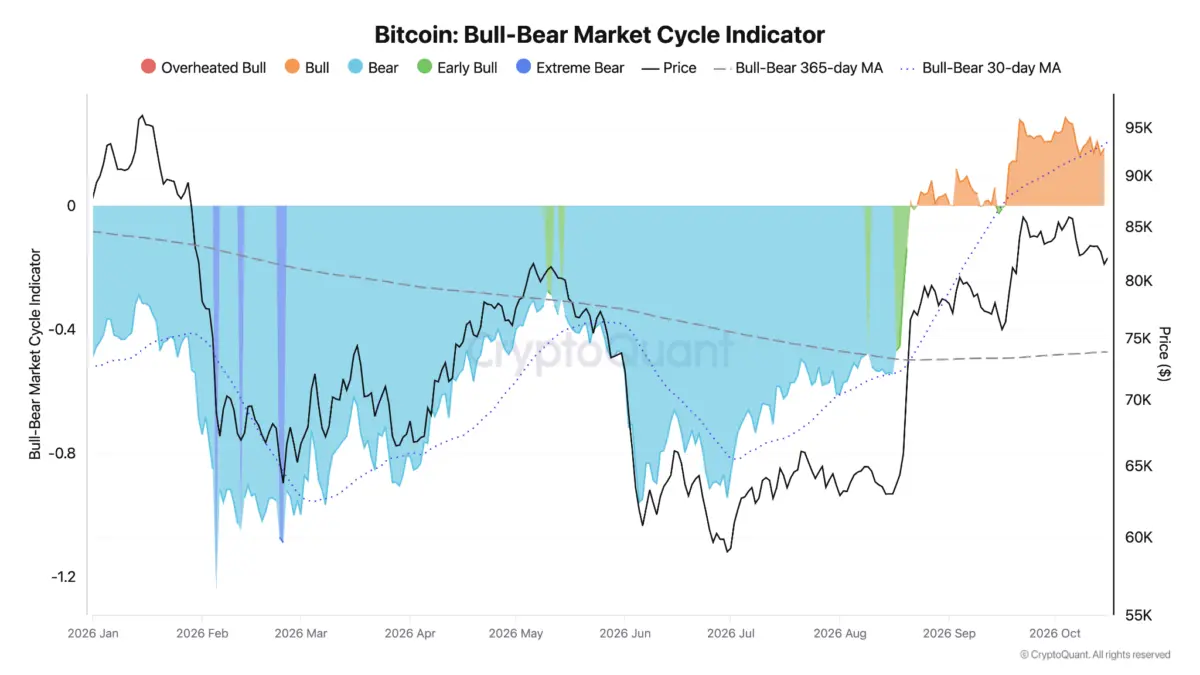
Earlier in the market cycle, CryptoQuant CEO Ki Young Ju formally declared that the broader bear market phase had concluded, basing his assessment on comprehensive readings from the platform’s dedicated bull-bear market cycle indicator. This composite indicator synthesizes data from multiple on-chain profitability and capital-flow metrics to determine the macro health of the network. Recent readings have demonstrated that bullish momentum is actively accelerating, registering a score of 0.186 on the indicator’s standardized scale, a marked recovery from the lower readings observed during the summer months.
As Bitcoin continues to test the resolve of market participants around the inflection frontier, the interplay between derivative market liquidations, order book liquidity, and foundational on-chain metrics will likely dictate the speed and conviction of the next major price movement. Whether the digital asset can decisively pierce its 20-month moving average resistance and reestablish an upward trajectory toward its upper Bollinger Band remains the central question for traders and institutional allocators alike as the market moves through the final quarter of the year.