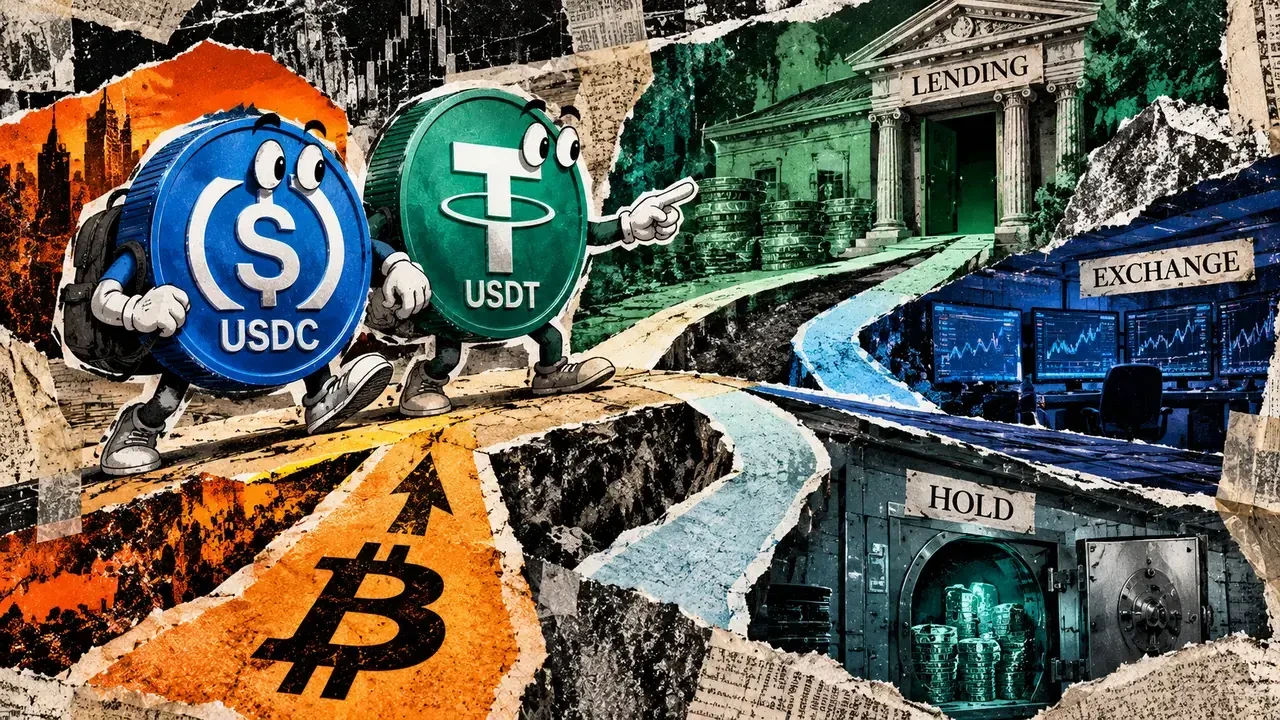
The growing supply of major dollar stablecoins like USDC and USDT cannot be viewed as a single, homogenous pool of sidelined cash waiting to purchase Bitcoin, according to a comprehensive research study published by Coin Metrics. The findings reveal that the two leading stablecoin issuers respond to vastly different market catalysts, investor behaviors, and utility demands. This divergence introduces critical complexities for cryptocurrency investors who routinely rely on aggregate stablecoin issuance metrics as a primary indicator for upcoming spot-buying demand in assets such as Bitcoin.
The study, which examined weekly observations over a four-year period, demonstrates that stronger non-stablecoin crypto-market returns have opposing predictive relationships with the two dominant assets. Specifically, positive broader market returns are associated with slower USDC growth in the subsequent week, while simultaneously correlating with faster USDT growth. Furthermore, researchers identified a distinct lending-yield association that applies almost exclusively to USDC rather than its market counterpart.
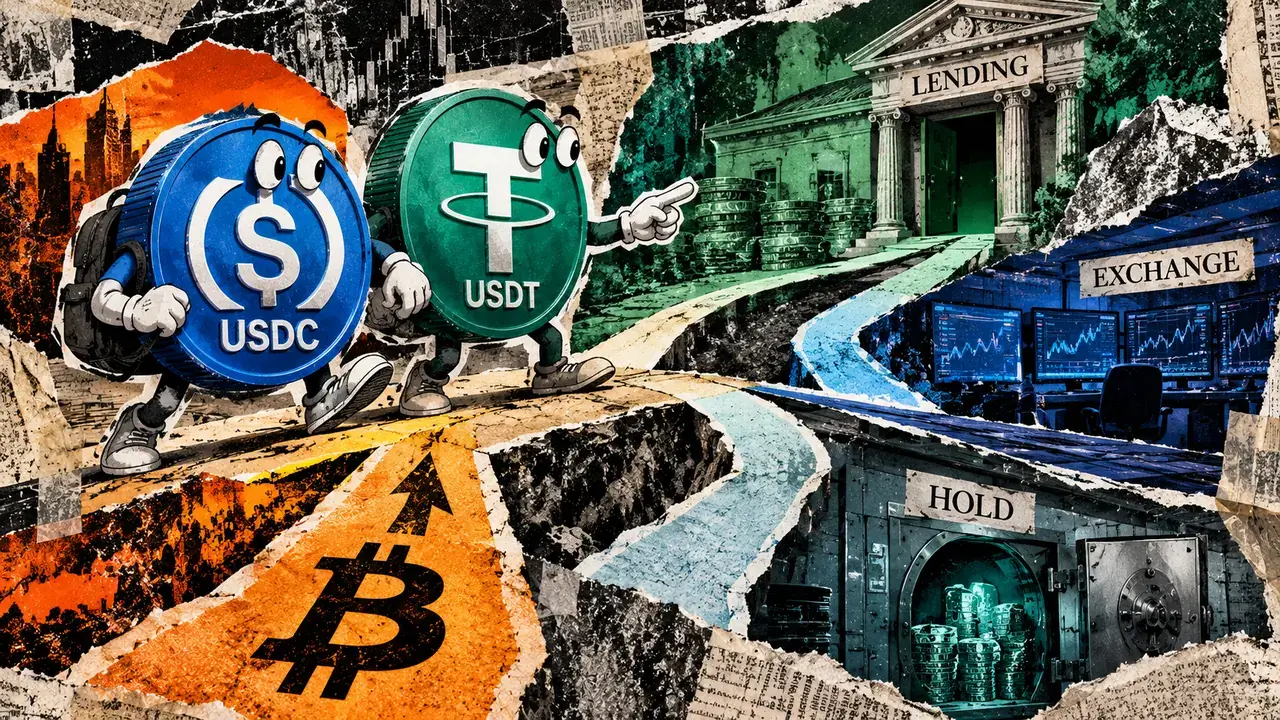
These underlying behavioral differences carry profound implications for market participants. When a new dollar-backed token enters circulation, it can serve a wide array of financial functions—such as acting as collateral for a borrower, earning passive interest for a lender, or simply providing a safe haven for an investor looking to remain in cash—long before that capital ever reaches a Bitcoin exchange for a spot trade. Consequently, aggregate stablecoin supply figures, which merely measure the total volume of tokens outstanding, require a much deeper layer of qualitative analysis before analysts can accurately interpret issuance spikes as fresh purchasing power.
What USDC and USDT Regressions Reveal About Divergent Demand
To understand why issuer composition matters so profoundly, the Coin Metrics study evaluated six distinct market drivers from preceding weeks to gauge their impact on subsequent supply growth. Among the tested variables, higher perpetual-futures funding rates demonstrated a positive relationship with growth for both issuers, accounting for approximately 10% of the weekly supply-growth variation for USDC and roughly 4% for USDT after controlling for other factors. This shared sensitivity points to periods of heightened leverage and bullish speculative activity where traders require additional collateral across both ecosystems.
However, a separate analysis beginning in 2023 uncovered a stark point of divergence. Researchers examined the carry spread—defined as the gap between the annual percentage yield offered by the decentralized lending protocol Aave v3 and the three-month United States Treasury yield. This metric introduced significant explanatory power specifically for USDC supply movements, yet yielded no meaningful incremental value for USDT or the combined aggregate supply beyond what funding rates already captured.
Despite these insights, the lagged issuer models account for only about 13% of the weekly fluctuations in USDC supply growth and roughly 16% for USDT. None of the econometric models evaluated by the study account for more than 25% of total movement, leaving the vast majority of weekly supply changes unexplained. These historical associations highlight statistical correlations rather than direct causation, and they do not explicitly test or predict future Bitcoin returns. The data clearly shows that a positive relationship for one issuer and a negative relationship for another can coexist simultaneously within the exact same aggregate total.
This complexity is further compounded by the distinct nature of collateral demand. A professional trader requiring dollar-denominated collateral to maintain open derivatives positions and an institutional investor choosing to hold stable balances as a risk-off strategy contribute equally to aggregate stablecoin demand. As a result, identical headline supply readings can easily conceal entirely different underlying investor intentions and market mechanics.
Tracing the Destination of Newly Minted Stablecoins
The lifecycle of a stablecoin begins long before any interaction with Bitcoin order books. Circle, the issuer of USDC, describes a minting process that originates when a customer deposits traditional fiat dollars into designated bank accounts in exchange for newly minted digital tokens, with redemptions operating in reverse to remove tokens from circulation. Tether outlines a similarly broad set of use cases for USDT, explicitly noting that tokens are routinely utilized for global payments, remittances, and exiting volatile market positions. A holder who retains stablecoins in their wallet after reducing portfolio risk has made a fundamentally different financial decision than a trader deploying capital to buy Bitcoin, despite both utilizing the exact same token infrastructure.
Lending protocols represent another major destination for newly issued liquidity. Platforms like Aave allow users to supply digital assets into massive liquidity pools where they earn variable interest rates while simultaneously serving as collateral for borrowing other assets. Furthermore, existing tokens frequently circulate through peer-to-peer transfers between various market participants without requiring any new minting activity, effectively decoupling growth in overall circulation from immediate trading volume.
This distinction is equally critical when evaluating cryptocurrency exchange reserves. Market analysts frequently track stablecoin balances held on major centralized platforms such as Binance and Bybit to gauge immediate liquidity available for Bitcoin acquisitions. While exchange-hosted balances reside physically closer to trading venues than tokens locked in cold storage or decentralized finance protocols, an exchange deposit still represents an intermediate step rather than a completed transaction. Depositing capital onto an exchange means the funds are prepared for deployment, but they may ultimately be used for shorting, leveraged trading, or remaining idle awaiting favorable market conditions rather than executing a spot Bitcoin purchase.
Yield Spreads and the Importance of Timestamps in Lending Markets
Real-time blockchain monitoring data from analytics platforms such as Aavescan illustrates how quoted supply annual percentage rates fluctuate significantly between live readings and daily snapshots. For instance, comparing the midnight UTC observation rates from mid-October provides a snapshot of how decentralized finance yields compare against traditional risk-free benchmarks. On Ethereum v3 liquidity pools, Aave quoted supply annual percentage rates for USDC reached 11.5%, while USDT hovered significantly lower at 3.1%.
These decentralized lending figures can be evaluated alongside traditional macroeconomic benchmarks, such as the three-month Treasury constant maturity rate reported by the Federal Reserve Economic Data, which stood at 4.27% on a comparable investment basis. Analysts emphasize that comparing these figures requires careful attention to quotation methodologies. Aave quotes represent point-in-time supply annual percentage rates that exclude historical incentive programs, whereas Treasury metrics reflect annualized simple interest without compounding.
Moreover, aligning calendar dates does not synchronize intraday market observations, match varying holding periods, or replicate the complex historical annual percentage yield calculations utilized in broader econometric studies. Point-in-time snapshots can frequently miss sharp intraday volatility, as true interest accrual is measured through the continuous growth of an underlying interest index over a specific time interval.
Crucially, any yield comparison must account for the underlying structural risks inherent to decentralized finance. Interacting with lending protocols exposes capital to smart-contract vulnerabilities, oracle failures, collateral liquidation risks, and broader network-layer challenges that do not apply to sovereign debt instruments. Ultimately, while combined USDC and USDT supply figures provide a helpful broad overview of potential digital dollar liquidity, tracing the exact journey of these tokens from initial issuance to their final destination remains essential for determining how much of that liquidity is actually transforming into active purchasing power for Bitcoin.