
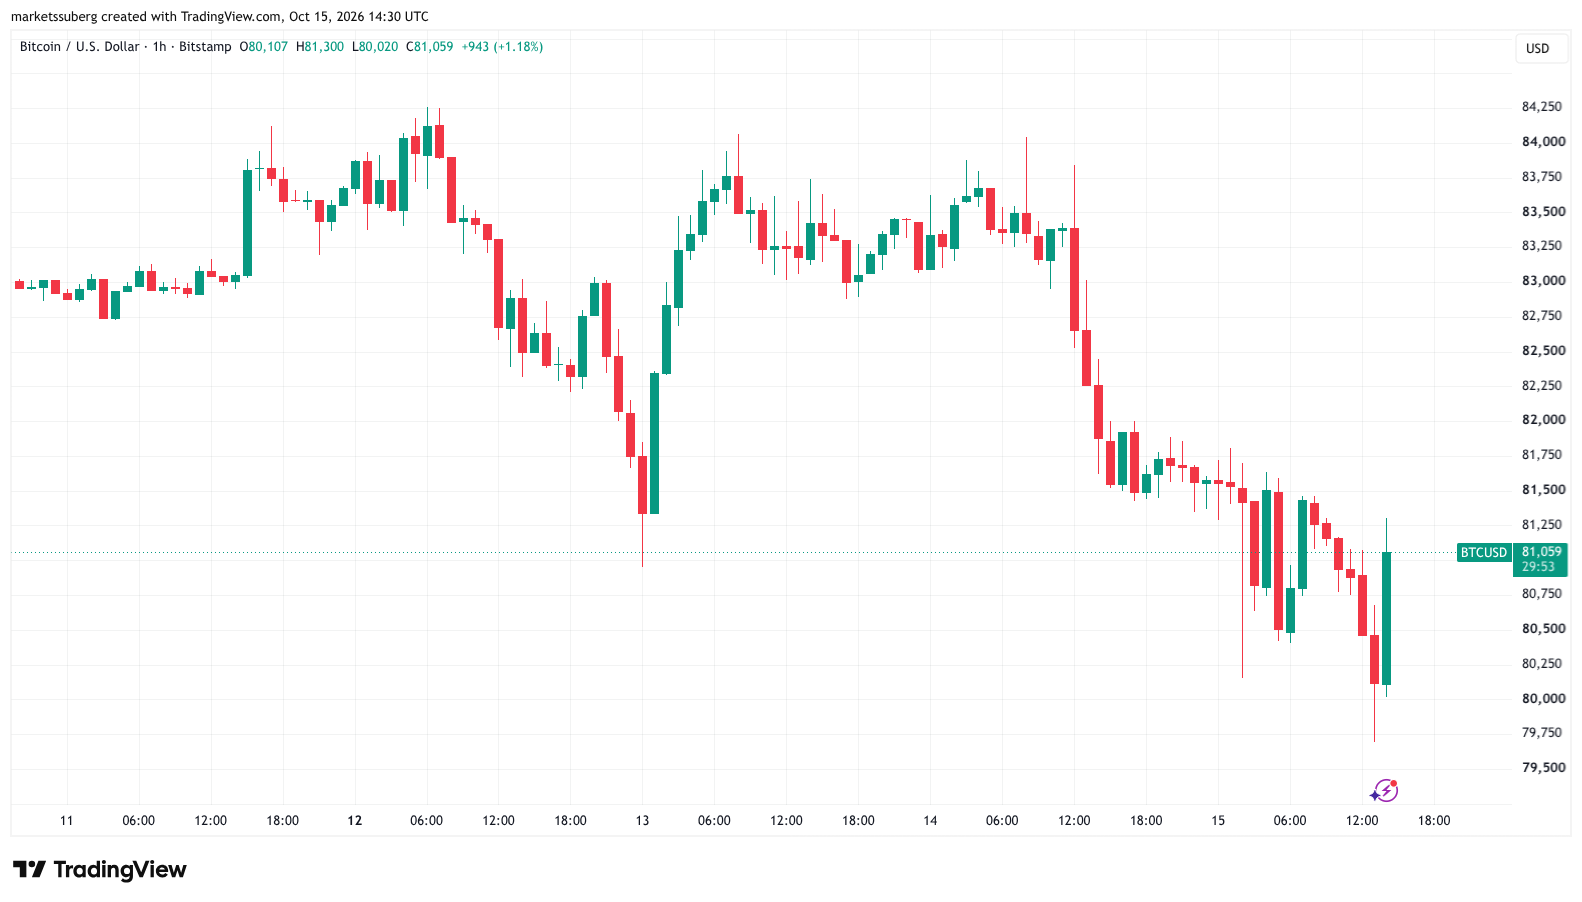
Bitcoin (BTC) experienced a notable downturn on Thursday, slipping below the $80,000 threshold following the release of United States Producer Price Index (PPI) data that significantly overshot market expectations. The cryptocurrency market, already navigating a turbulent global macroeconomic environment, reacted sharply to the hotter-than-expected inflation figures, which added fresh headwinds to risk assets across the board.
According to data from TradingView, the BTC/USD trading pair dropped to its lowest level since September 18. During the session, Bitcoin declined by as much as 1.8% before staging a partial recovery to trade around the $81,000 mark. The sudden price movement brought key technical support levels and broader economic concerns back into the spotlight for traders and analysts tracking the digital asset markets.

Biggest PPI Increase Since March 2022 Adds to Bitcoin Tailwinds
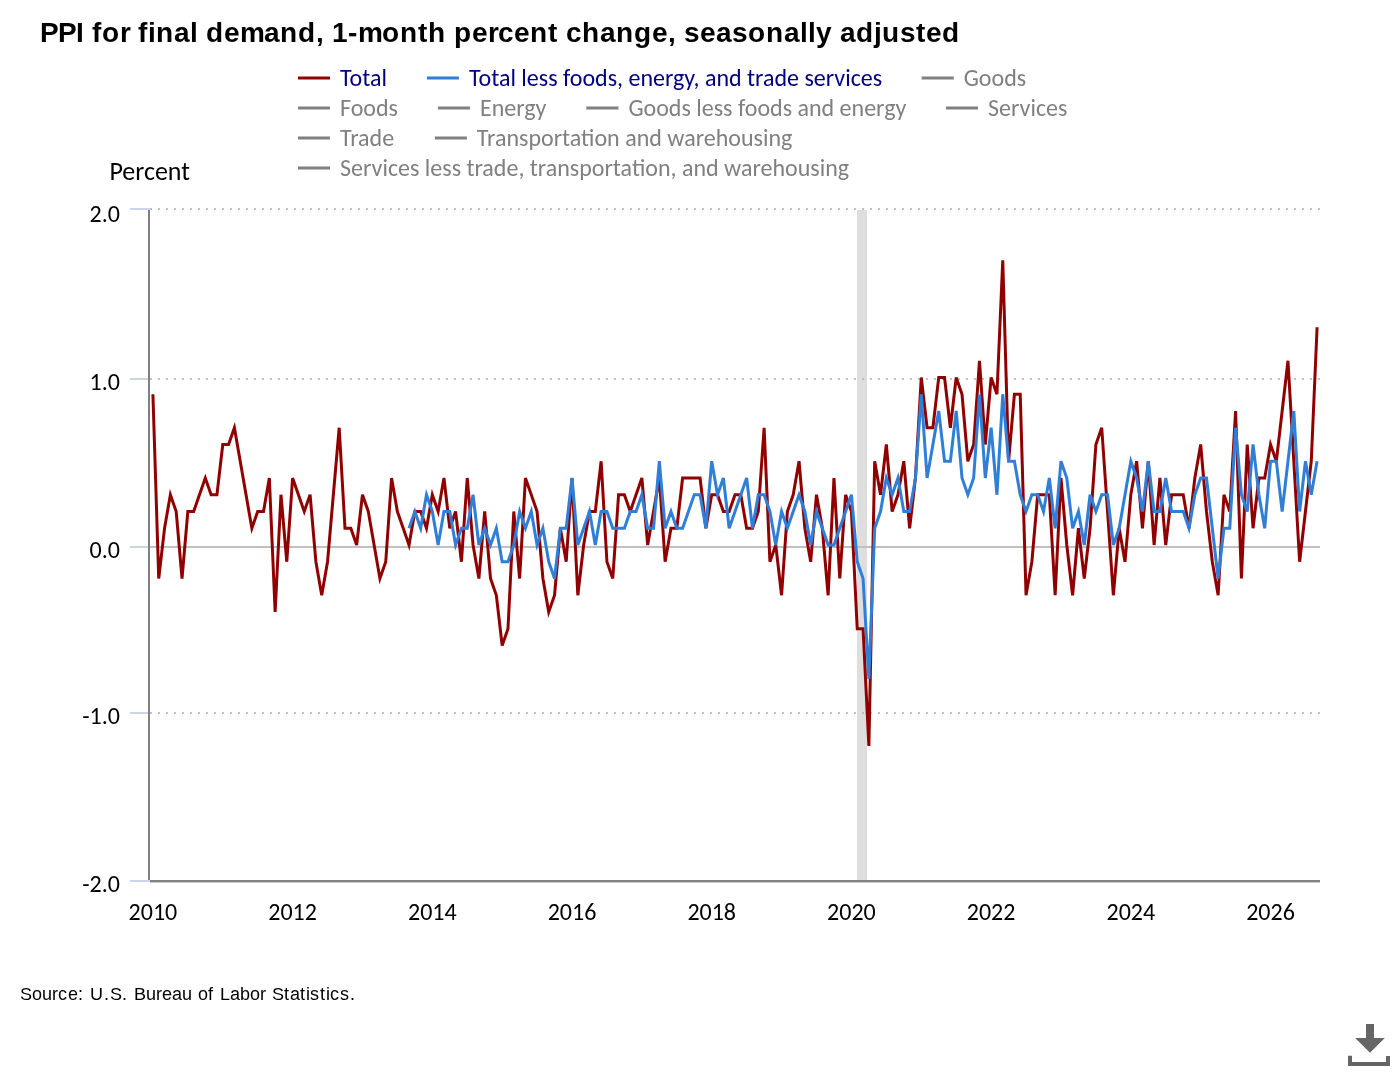
The downward pressure on Bitcoin intensified after the Bureau of Labor Statistics (BLS) published its latest inflation data. According to the report, the September PPI came in at a headline figure of 6.3%, sitting a full 100 basis points above what economists and market participants had anticipated. Meanwhile, core PPI rose to 5%, outpacing the expected 4.4% projection.
The official news release from the BLS underscored the severity of the jump, noting that the September increase represented the largest monthly advance since the index rose 1.7% in March 2022. Furthermore, on an unadjusted basis, the final demand index climbed 6.3% for the 12-month period ending in September, marking the largest annual increase since the 6.4% gain recorded in December 2022.
This hotter-than-expected producer inflation report followed closely on the heels of Consumer Price Index (CPI) figures released just a day prior, which also overshot estimates and triggered immediate declines across cryptocurrencies and other risk-on asset classes. Compounding these macro pressures, risk assets were already feeling the strain from an international tech sell-off. Most notably, South Korea experienced a severe market correction on Thursday, with the KOSPI Composite Index tumbling 7.5% to reach its lowest close since April.
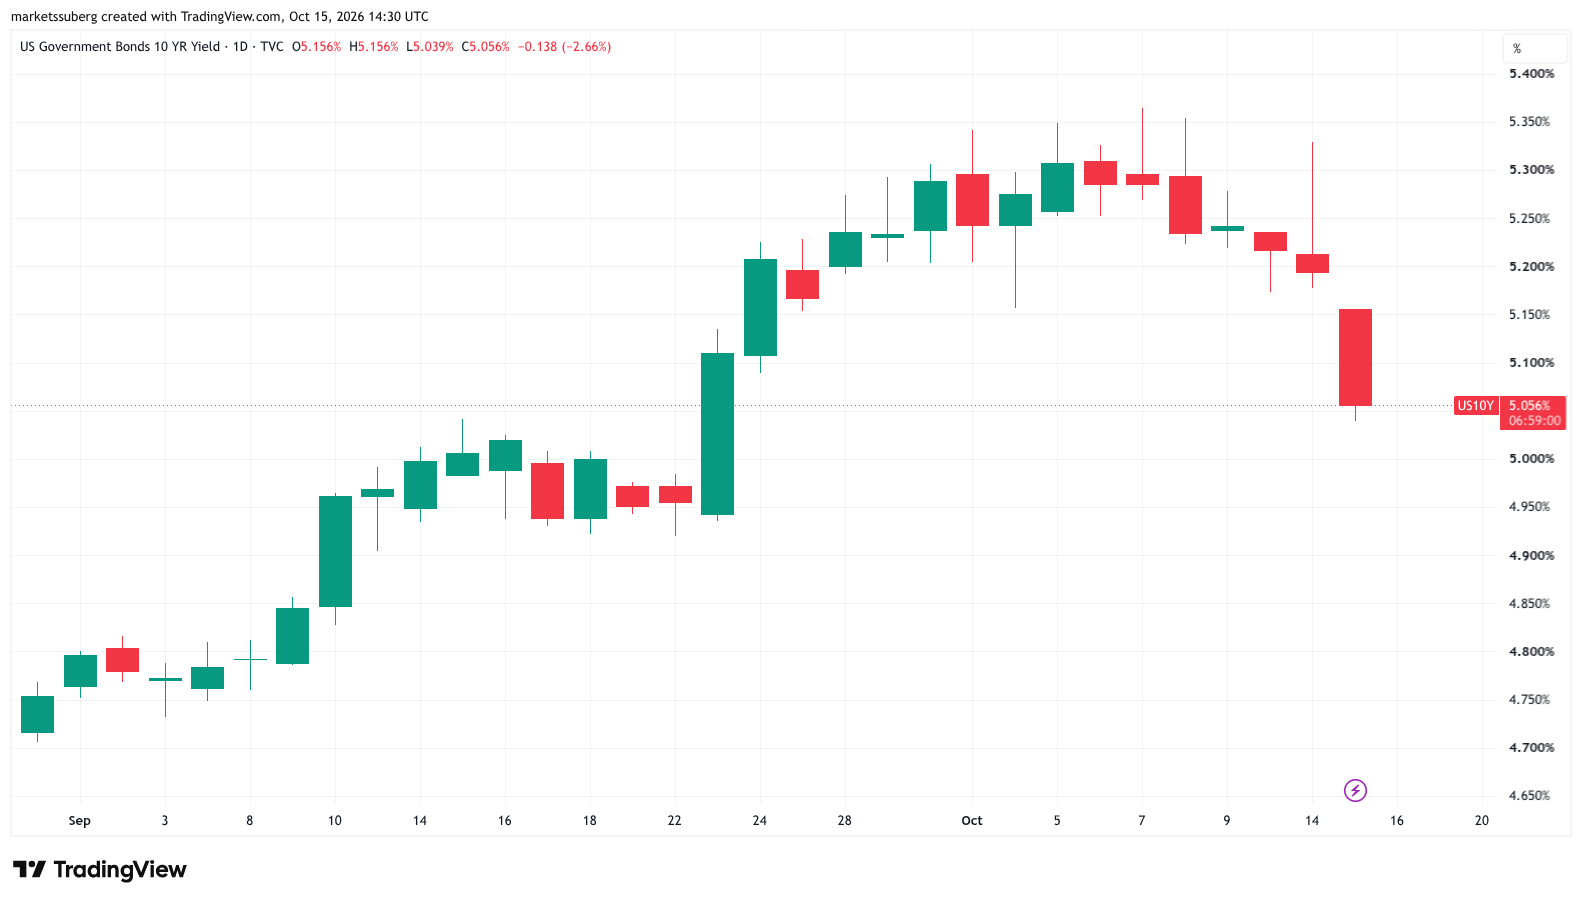
Prominent economist Mohamed El-Erian weighed in on the inflation reports, describing the PPI print as "even more striking" than the preceding CPI results. However, El-Erian and other financial observers pointed out a puzzling market dynamic: US bond yields were uncharacteristically failing to rise in tandem with the higher inflation numbers. At the time of writing, the US 10-year bond yield was down nearly 3%, hitting its lowest levels since September 23.
Robin Brooks, the former chief FX strategist at Goldman Sachs, addressed this phenomenon by highlighting earlier findings which suggested that yields had "decoupled" from broader US macroeconomic data. According to Brooks, market priorities appear to have shifted away from traditional inflation tracking and toward the government’s handling of the federal budget deficit.
Analyzing the 30-day correlation between upside economic data surprises and daily movements in the 10-year yield, Brooks revealed that the metric had dropped from near 0.6 earlier in the year to just below zero by the end of August. In a blog post published the previous month, he summarized that this shift indicates yields have decoupled from incoming data because markets are increasingly focused on the trajectory of the national deficit, pushing up longer-term yields regardless of whether data surprises point higher or lower.
Analysis Eyes “Early-Stage Bull Market” Support Retest
As macro conditions weighed heavily on traditional and digital markets alike, Bitcoin’s recent price action thrust two major support trend lines back into sharp focus: the 21-week and 50-week exponential moving averages (EMA), which sit at $76,144 and $78,459, respectively.
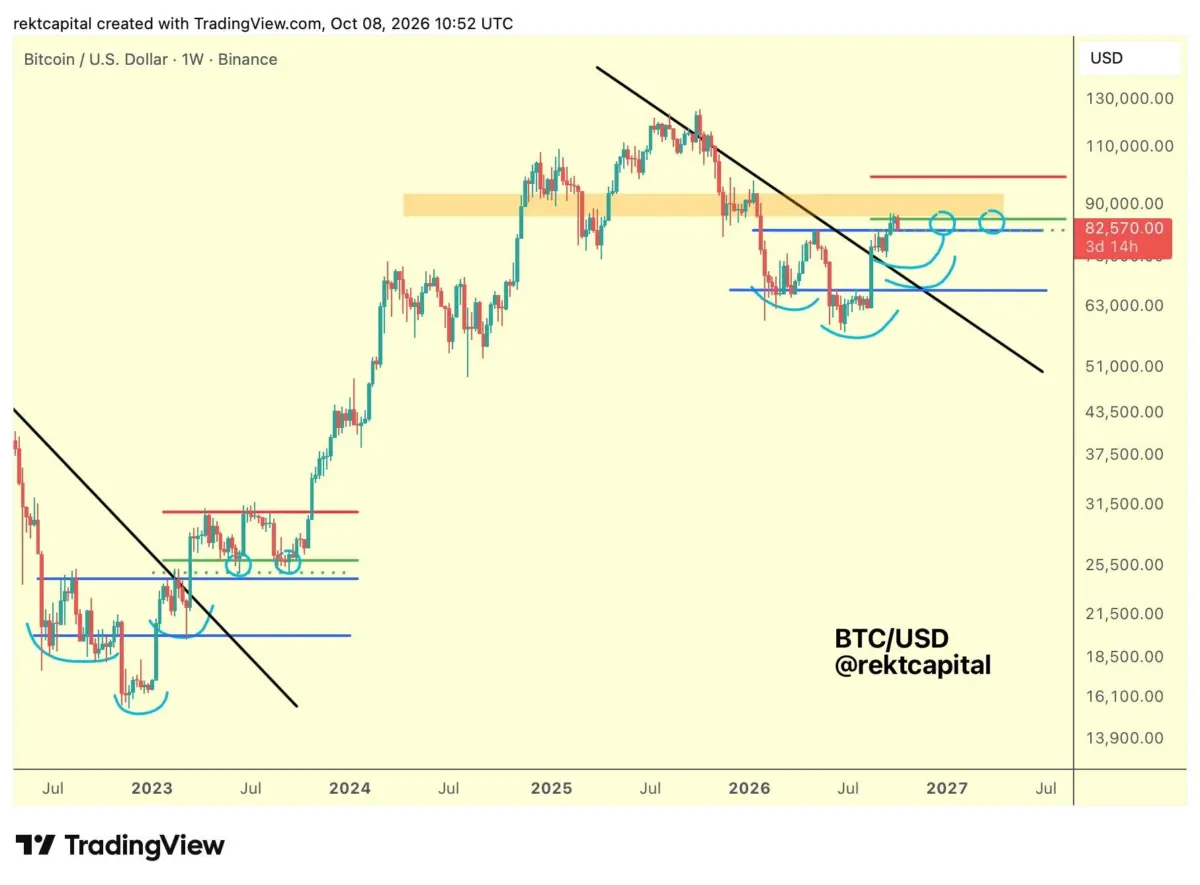
Trader and popular market analyst Rekt Capital noted that despite the recent downside volatility, BTC/USD still has room to retest both moving averages while preserving its broader bullish market structure. According to the analyst, historical precedent suggests that deviating below these key EMAs during a volatile retest to find a pullback bottom is a common occurrence in early-stage bull markets. However, he pointed out that these deviations typically happen following a bullish crossover of the two EMAs, whereas Bitcoin remained in a pre-crossover state during the current market phase.
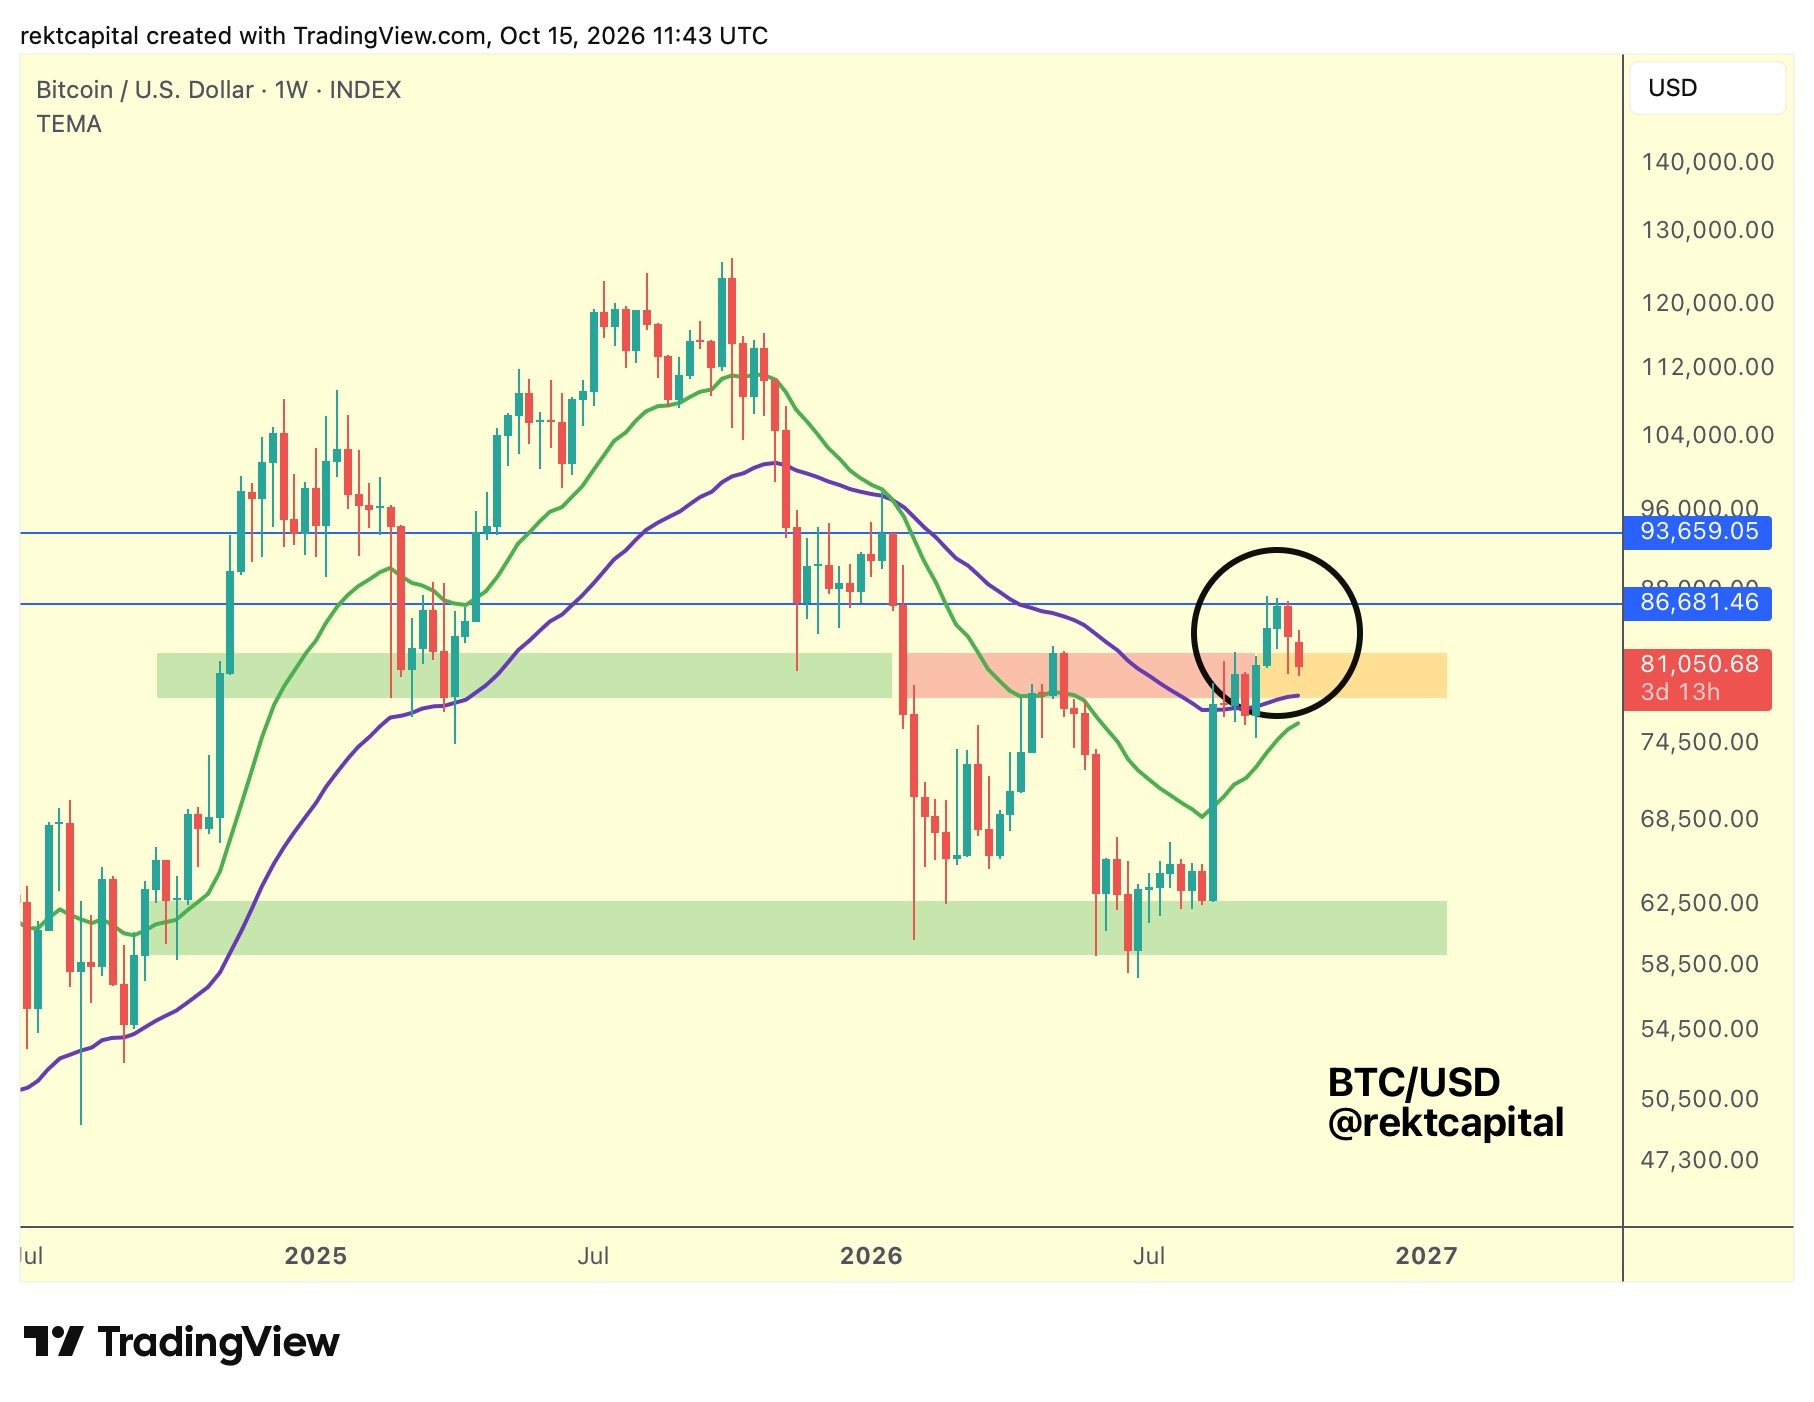
Prior to the dip, Bitcoin had been struggling to maintain momentum above the crucial price region between $82,500 and $82,800, which has served as a heavily watched area of interest for market speculators and traders dealing with exchange liquidations over recent weeks.
Adding to the technical outlook, analyst Aksel Kibar observed that Bitcoin’s latest weekly close of around $83,700 lacked the underlying strength typically associated with a decisive breakout. Kibar cautioned that a weekly close falling back inside the established range could easily lead to a resumption of wide consolidation, keeping prices bound within a $60,000 to $82,800 corridor, while identifying the $75,000 level as a vital negation threshold for the ongoing rectangle bottom reversal pattern.