Bitcoin is once again attempting to break through a formidable technical and psychological barrier known as the "inflection frontier," a crucial trend line that has historically acted as a springboard for explosive runs toward new macroeconomic highs. As the broader digital asset market navigates ongoing macroeconomic headwinds and shifting liquidity dynamics, onchain data indicates that the asset’s multi-month consolidation phase has effectively concluded, setting the stage for a potential test of major resistance levels.
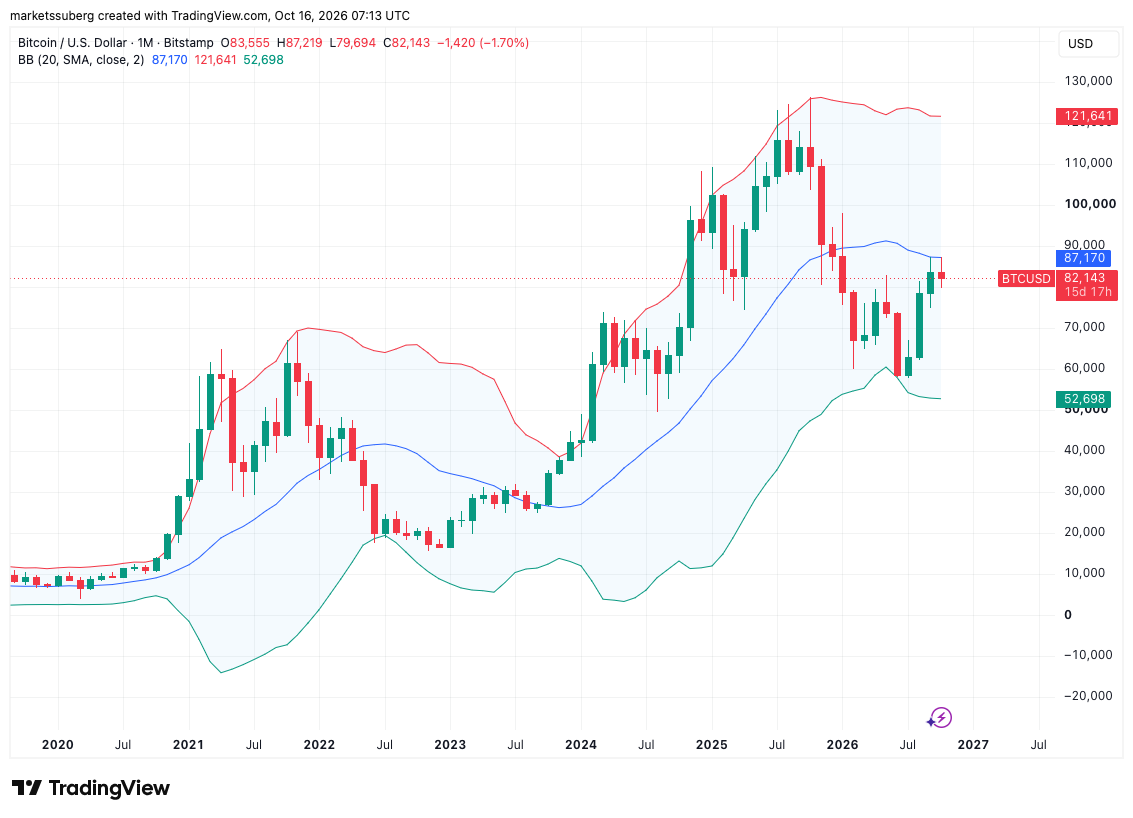
According to data compiled by the onchain analytics platform CryptoQuant, Bitcoin has initiated a fresh battle with its 20-month simple moving average (SMA). As of mid-October, this key trend line stands at $87,165. The 20-month SMA holds a foundational role in technical analysis, as it serves as the baseline around which the popular Bollinger Bands metric is constructed. This statistical framework ultimately forms the backbone of CryptoQuant’s proprietary market cycle signals tool, designed to pinpoint Bitcoin’s exact positioning within its broader cyclical trajectory.
The Bollinger Bands framework utilizes standard deviation to project an upper and lower band surrounding the central 20-month SMA. Currently, these upper and lower boundaries sit at $121,640 and $52,694, respectively. Within CryptoQuant’s market indicator methodology, the geographical zone situated between the lower band and the 20-month SMA is designated as an "accumulation base." Meanwhile, the SMA itself is defined as an inflection frontier—a historical zone of heavy investor capitulation that materializes whenever the spot price breaks below it from an overhead position, a phenomenon most recently observed during the market correction in December 2025.

With Bitcoin now preparing to challenge this historical capitulation zone from below, market history suggests that a successful and sustained breakout above this moving average has characteristically paved the way for unprecedented cycle highs. Observers are closely watching how price action interacts with this threshold, particularly as market participants weigh short-term price volatility against longer-term structural indicators.
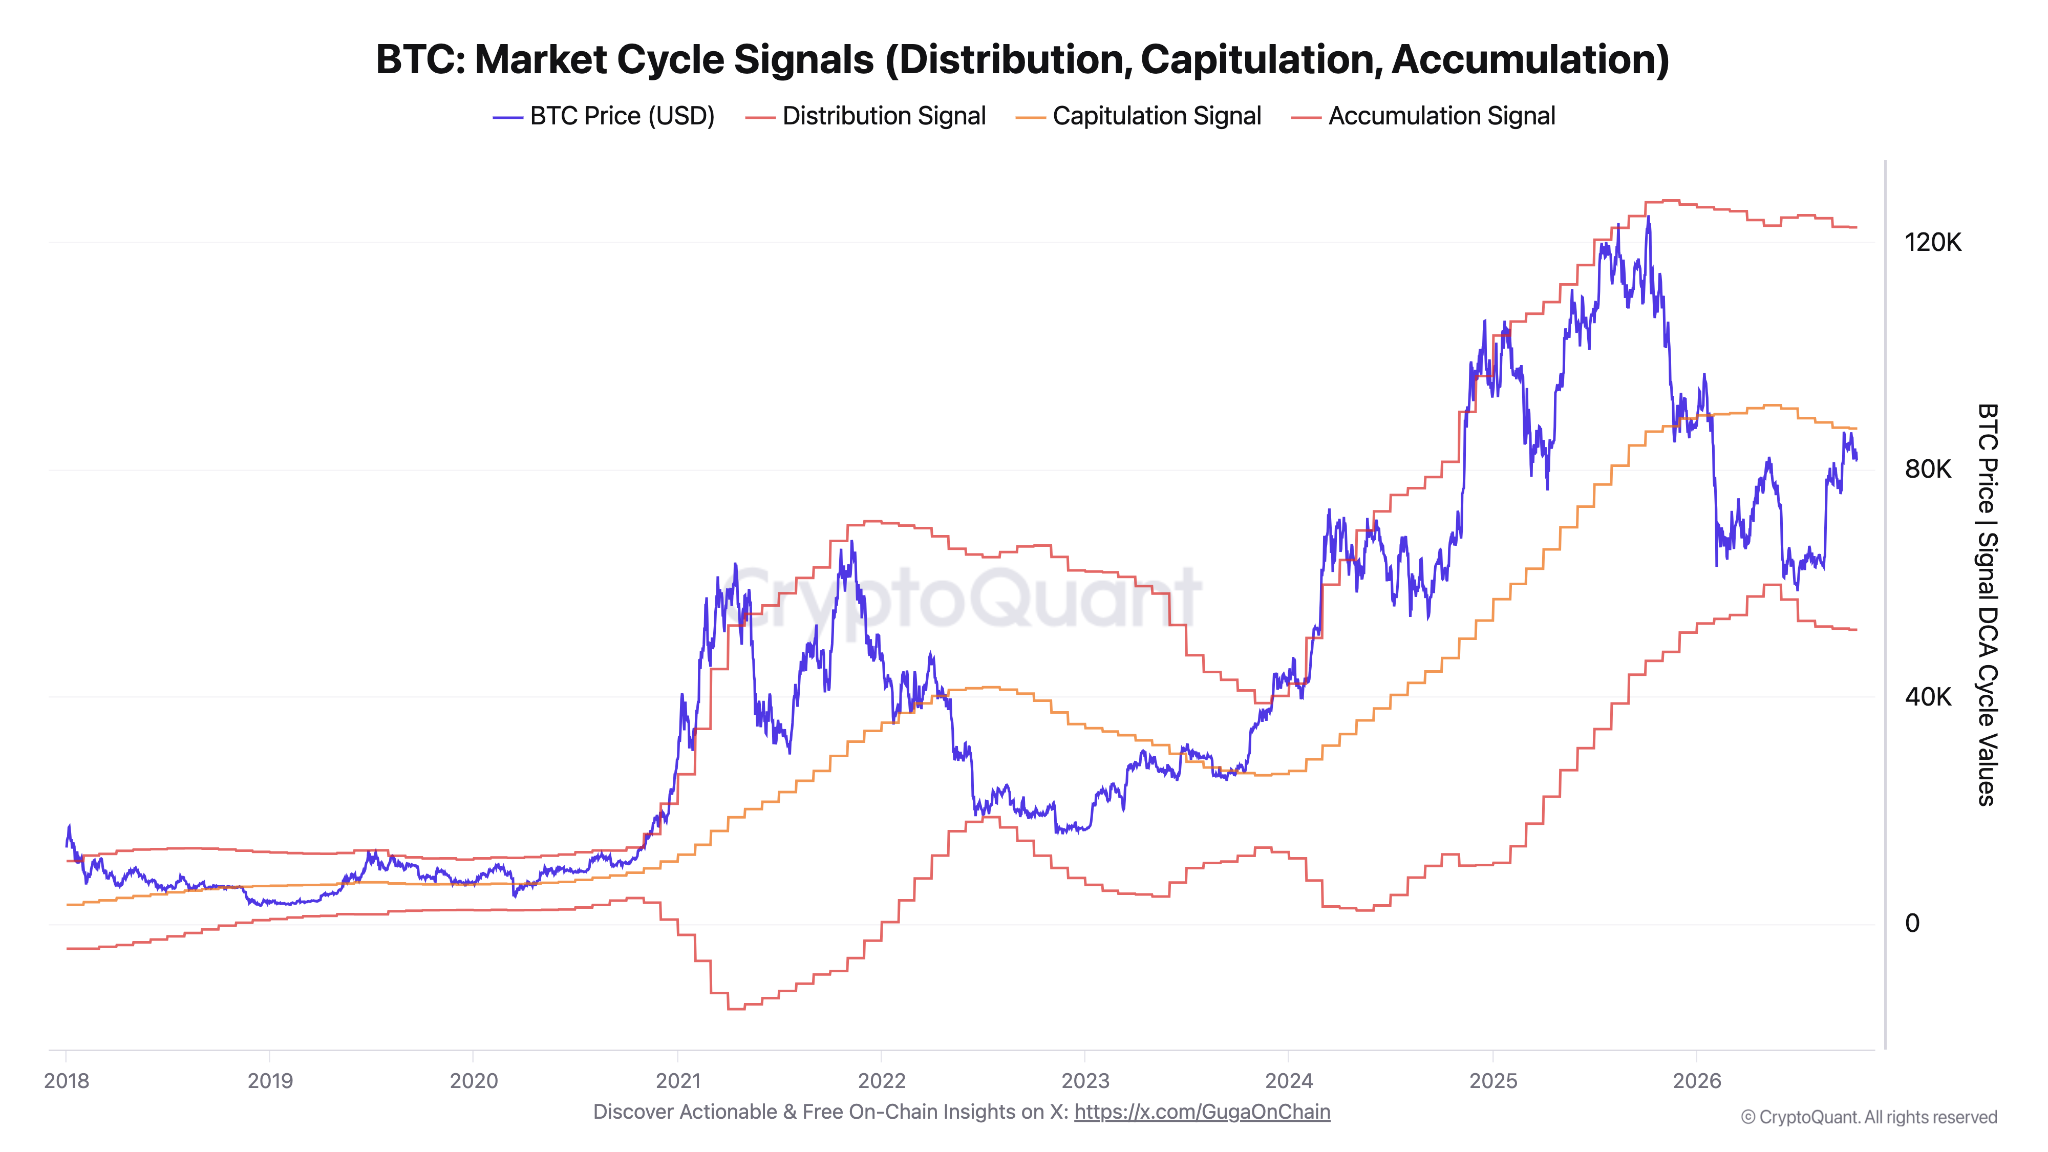
Just over a year following Bitcoin’s all-time high of $124,709, which was recorded on October 6, 2025, the broader market has officially concluded its extensive structural reset. This assessment was recently highlighted by CryptoQuant contributor GugaOnChain in a detailed market insight post, addressing the psychological state of market participants as prices fluctuate near support levels.
Although Bollinger Bands are primarily designed to measure market volatility and deviation rather than generate direct buy and sell signals, the accompanying market cycle indicators offer deeper insight into institutional behavior. Historically, these signals highlight "smart money" entities actively taking profits once the BTC/USD pair successfully reaches its upper Bollinger Band. While that upper band currently hovers just below Bitcoin’s most recent all-time high of $126,200, which was established in October 2025, onchain analysts anticipate that any subsequent breakout rally will possess the underlying momentum required to push well beyond those previous peaks.
While retail investors often experience apprehension during market dips—frequently viewing price levels near $82,442 as a potential cycle top rather than a consolidation floor—on-chain metrics like the market cycle signals tool suggest that the broader macro trend is merely warming up. This price region aligns closely with a recognized short-term support zone that has been tested repeatedly amid macroeconomic pressures.
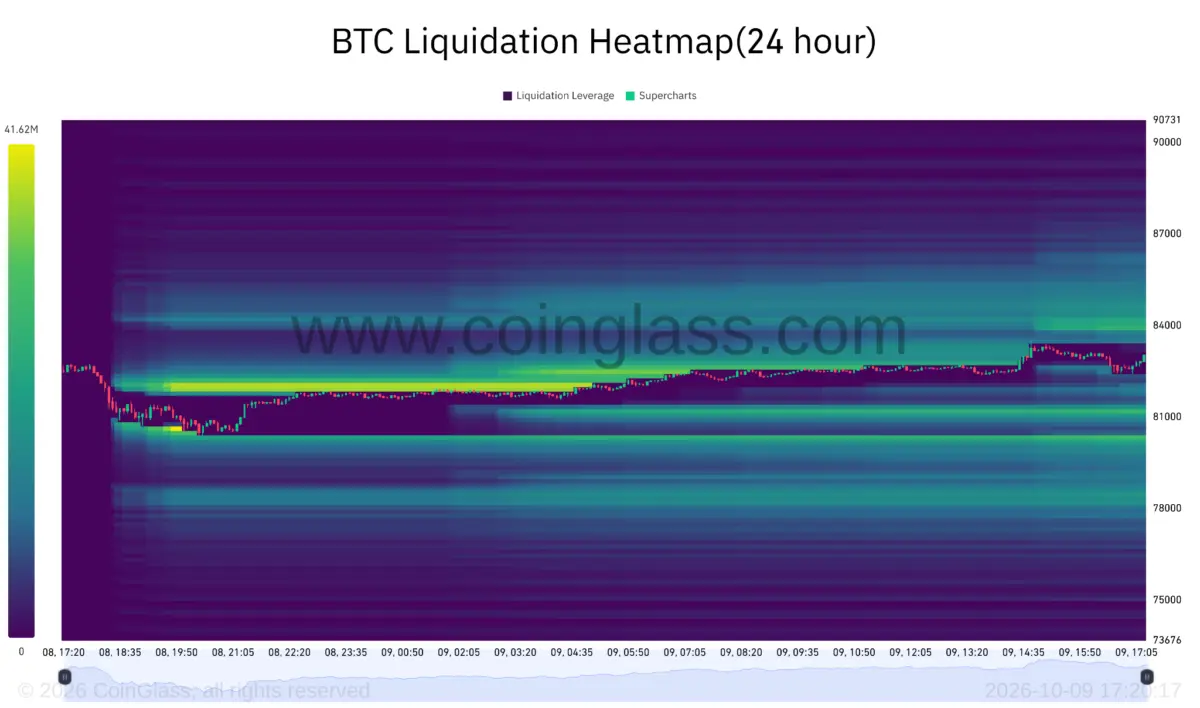
Adding to its technical significance, the 20-month SMA enjoys strong confluence with Bitcoin’s opening price level for 2026, which was established at $87,490. This convergence substantially reinforces the trend line’s strength as an overhead resistance barrier. Furthermore, exchange order book dynamics corroborate this technical resistance, showing substantial walls of ask liquidity clustered tightly within the immediate vicinity of these price levels.
Despite the complex interplay of macroeconomic pressures and intermittent bouts of volatility—including recent liquidations and a short-term dip beneath the $80,000 threshold following hotter-than-expected United States Producer Price Index data—CryptoQuant and its contributors maintain a broadly optimistic outlook regarding the health and durability of Bitcoin’s emerging bull market.
Earlier in the autumn, research entities such as XWIN Research Japan flagged a confluence of multiple onchain metrics that collectively pointed toward a resumption of bullish momentum. These indicators have provided analysts with renewed confidence as the market moves through the final quarter of the year.
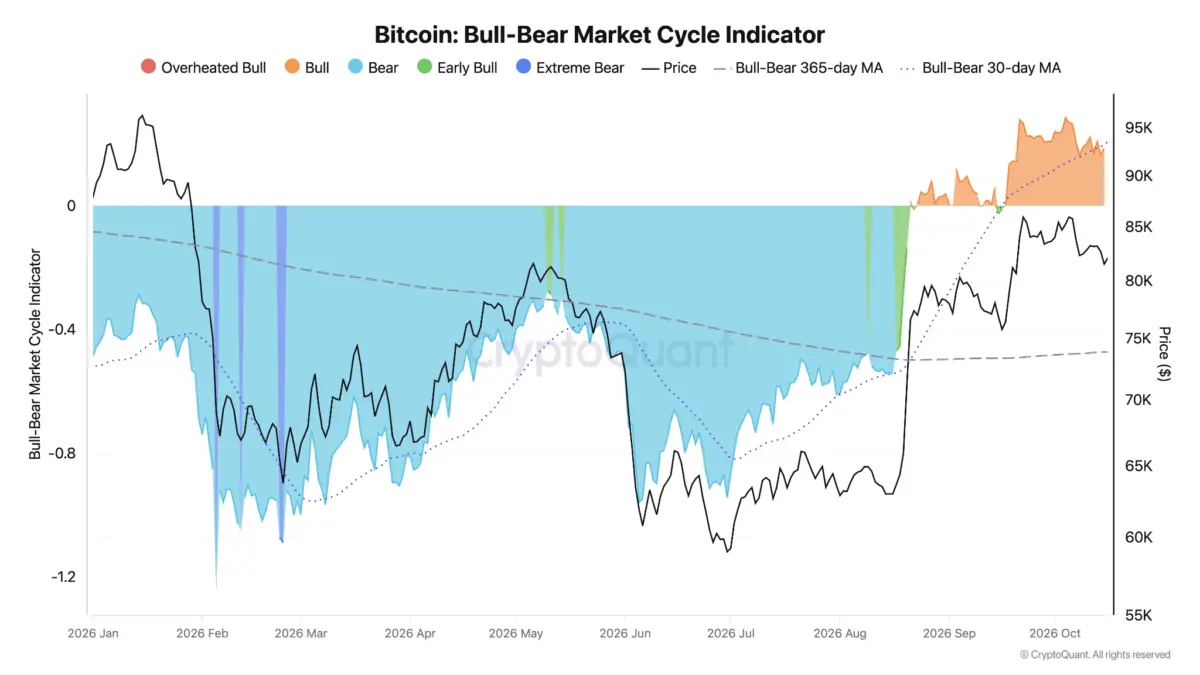
The foundational shift in market sentiment was formally signaled in late August, when CryptoQuant CEO Ki Young Ju declared that the broader bear market was definitively over. That proclamation was derived from readings generated by the platform’s comprehensive bull-bear market cycle indicator. By aggregating composite data from a wide array of onchain profitability metrics, the indicator has demonstrated an acceleration in underlying bullish momentum. Specifically, the metric has climbed to a reading of 0.186 on its standardized scale, marking a substantial recovery from the subdued 0.042 reading recorded back in August.
As Bitcoin continues its methodical ascent toward the 20-month SMA and the surrounding inflection frontier, market participants remain focused on whether sustained buying pressure can absorb the existing liquidity walls and decisively validate the completion of the market’s macroeconomic reset.