
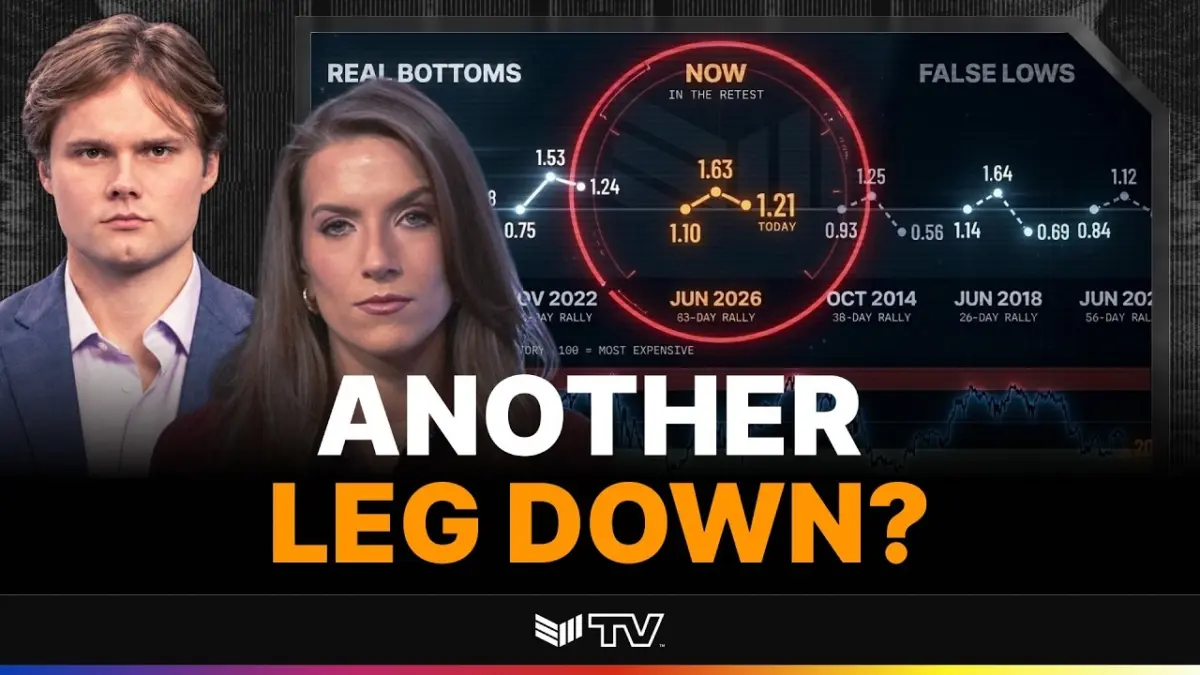
In the fast-paced world of digital asset markets, analysts are constantly searching for reliable metrics to decipher whether a market correction is merely a temporary relief rally or the final capitulation before a new macro cycle begins. On a recent segment of Bitcoin Magazine’s "Chart of the Day," host Sean turned his focus toward Bitcoin’s Market Value to Realized Value (MVRV) ratio to evaluate the current health of the asset. His breakdown highlights a precarious technical landscape, noting that the recent market pullback has already retraced roughly 80% of the gains achieved during the summer rally. By comparing current on-chain behavior with historical market cycles—specifically the stark lessons of 2018—the analysis sheds light on why holding the previous June low may not be enough to declare a definitive bear market bottom. Instead, all eyes are fixed on an MVRV value of 1.1, which roughly translates to the $59,000 price region, as the ultimate line in the sand.
To understand the weight of this assessment, it helps to examine what the MVRV ratio represents within the broader framework of on-chain analytics. By comparing Bitcoin’s total market capitalization to its realized capitalization—which values each UTXO (Unspent Transaction Output) at the price it last moved on-chain—MVRV offers a clear lens into aggregate market profitability. Historically, extreme highs in the MVRV ratio signal frothy, overheated market tops where participants are sitting on massive unrealized gains. Conversely, deep troughs and low MVRV readings point toward periods of capitulation, deep undervaluation, and generational buying opportunities where the average holder is underwater or holding marginal profits.
Sean’s analysis begins by looking at where this cycle’s low and subsequent relief rally fit into the historical tapestry of previous bear markets. Over the summer, Bitcoin experienced a notable recovery, breathing temporary life into a depressed market sentiment. However, the subsequent market pullback proved to be severe, wiping out approximately 80% of those summer gains. This aggressive retracement raises serious questions about the underlying strength of the rally. In traditional market analysis, when a relief rally gives back the vast majority of its gains in a short span, it often suggests that the broader macro downtrend remains intact, and that the bounce was driven by short-term positioning rather than sustained structural demand.
The distinction between true market bottoms and bear market rallies is critical for investors trying to navigate these turbulent waters. During prolonged crypto winters, the market frequently plays out complex psychological phases. Investors often rush to identify the definitive bottom based on psychological price levels or previous swing lows, only to find that market dynamics are far more nuanced. By analyzing how previous cycles behaved, analysts can better categorize whether current price action resembles the definitive flushing out of weak hands or merely a pit stop on the way to lower valuations.
When examining the structural templates of past cycles, Sean points out that the current market environment sits somewhere between distinct historical blueprints. Every market cycle possesses its own unique catalysts, macroeconomic backdrops, and liquidity profiles, yet human psychology and on-chain metrics frequently rhyme. This cyclical echoing is precisely what makes on-chain data tools like MVRV so valuable. They cut through the daily noise of market sentiment and media speculation, offering a mathematical reflection of investor behavior and cost basis distributions.
Delving deeper into the historical comparisons, the numbers appear to rhyme closely with the challenging environment witnessed in 2018. During that particular cycle, Bitcoin underwent a protracted bear market characterized by intense consolidation periods and devastating shakeouts. A common trap for market participants in 2018 was assuming that holding a previously established cyclical low would automatically guarantee a secure floor for the asset. As the historical record shows, market structures can easily break down under sustained macroeconomic pressure or shifting miner and holder dynamics, rendering previous support levels vulnerable to deep breaches.
This brings the discussion directly to the most critical technical threshold of the analysis: the 1.1 MVRV score. Based on the current distribution of coins and realized values, an MVRV ratio of 1.1 correlates to a Bitcoin price of approximately $59,000. In Sean’s assessment, this specific level acts as the ultimate line in the sand, determining whether Bitcoin’s macro bottom is already securely in place or if further downside remains on the horizon. If the price and its corresponding MVRV metric can successfully hold above this threshold, it would signal that long-term holders and market participants are absorbing supply effectively, preserving the integrity of the broader structural floor.
Conversely, a decisive breakdown below the 1.1 MVRV level—and the accompanying $59,000 price tag—would invalidate several bullish assumptions currently held by market participants. It would suggest that the market has not yet fully flushed out speculative excess and that deeper capitulation may be required before a sustainable accumulation phase can begin. This underscores why simply relying on holding the June low could prove to be a dangerous strategy for investors who fail to account for shifting on-chain realities. Historical precedent from 2018 demonstrates that initial support zones often fail when underlying profitability metrics dip below critical tipping points.
As the financial markets continue to evaluate Bitcoin’s trajectory, insights derived from tools like the MVRV ratio provide essential context for navigating volatility. Whether Bitcoin can defend the $59,000 threshold and maintain an MVRV score above 1.1 will likely dictate the market narrative for the weeks and months ahead. For market participants monitoring these developments, understanding the interplay between price action, realized capitalization, and historical cycle templates remains an indispensable part of risk management in the digital asset ecosystem.