

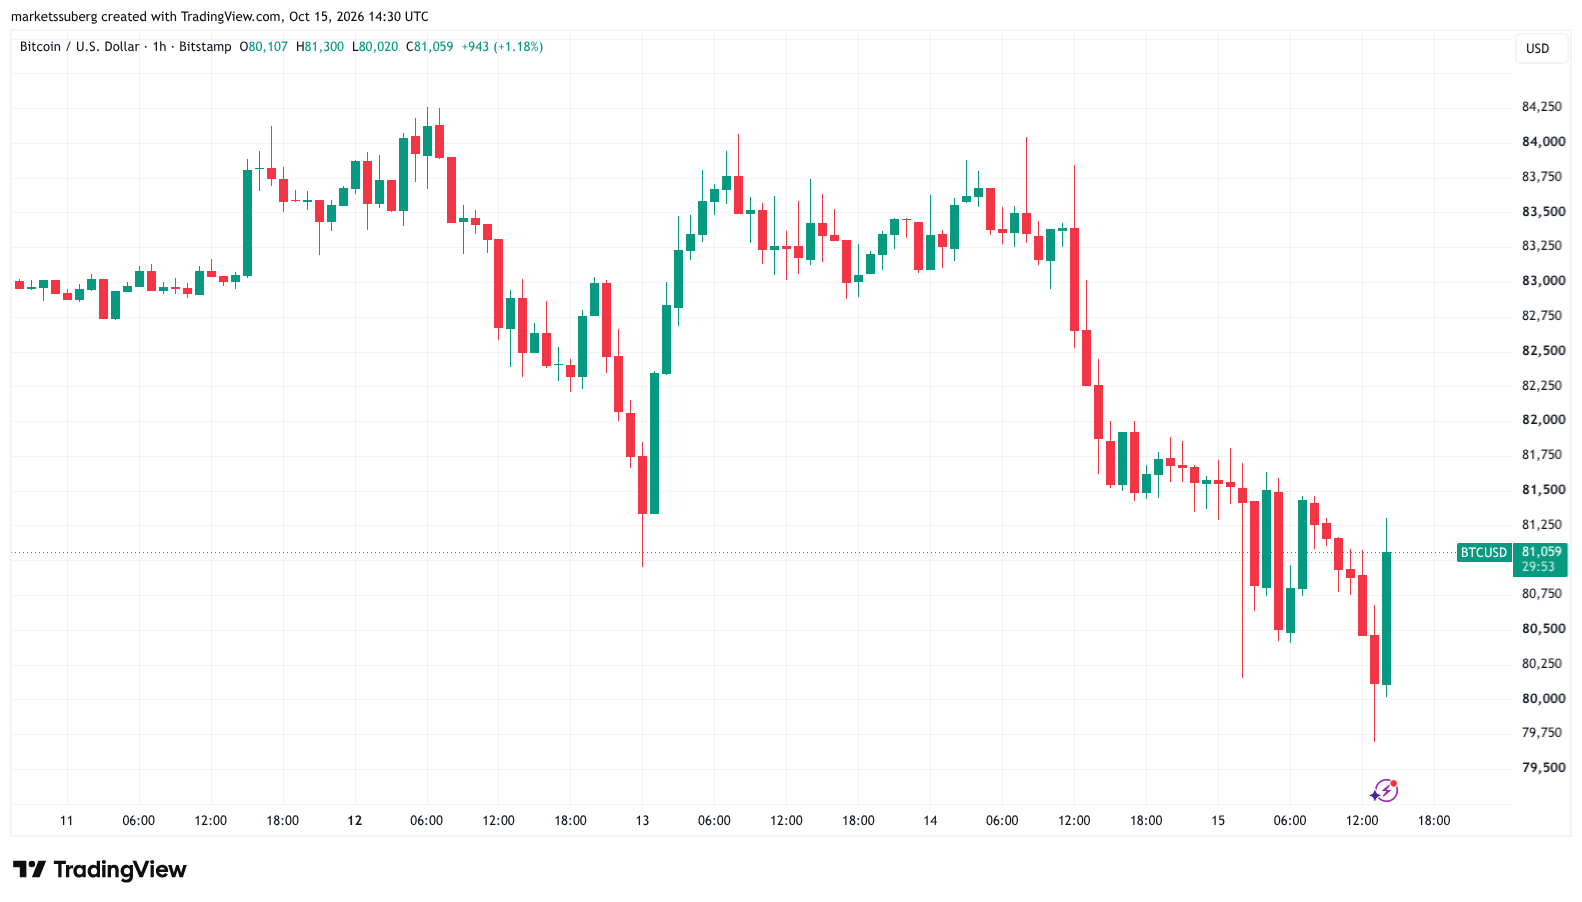
Bitcoin (BTC) dipped below the $80,000 threshold on Thursday, facing renewed downward pressure as United States Producer Price Index (PPI) data significantly outperformed market expectations. The sudden macroeconomic shock compounded ongoing volatility across global risk-on assets, leaving traders and analysts closely monitoring critical support trend lines to determine the near-term trajectory of the broader cryptocurrency market.
Biggest PPI Increase Since March 2022 Adds to Bitcoin Tailwinds
Data from TradingView illustrated the BTC/USD trading pair slipping to its lowest price levels since September 18. The premier cryptocurrency declined by as much as 1.8% during the trading session before staging a modest rebound to hover around the $81,000 mark.

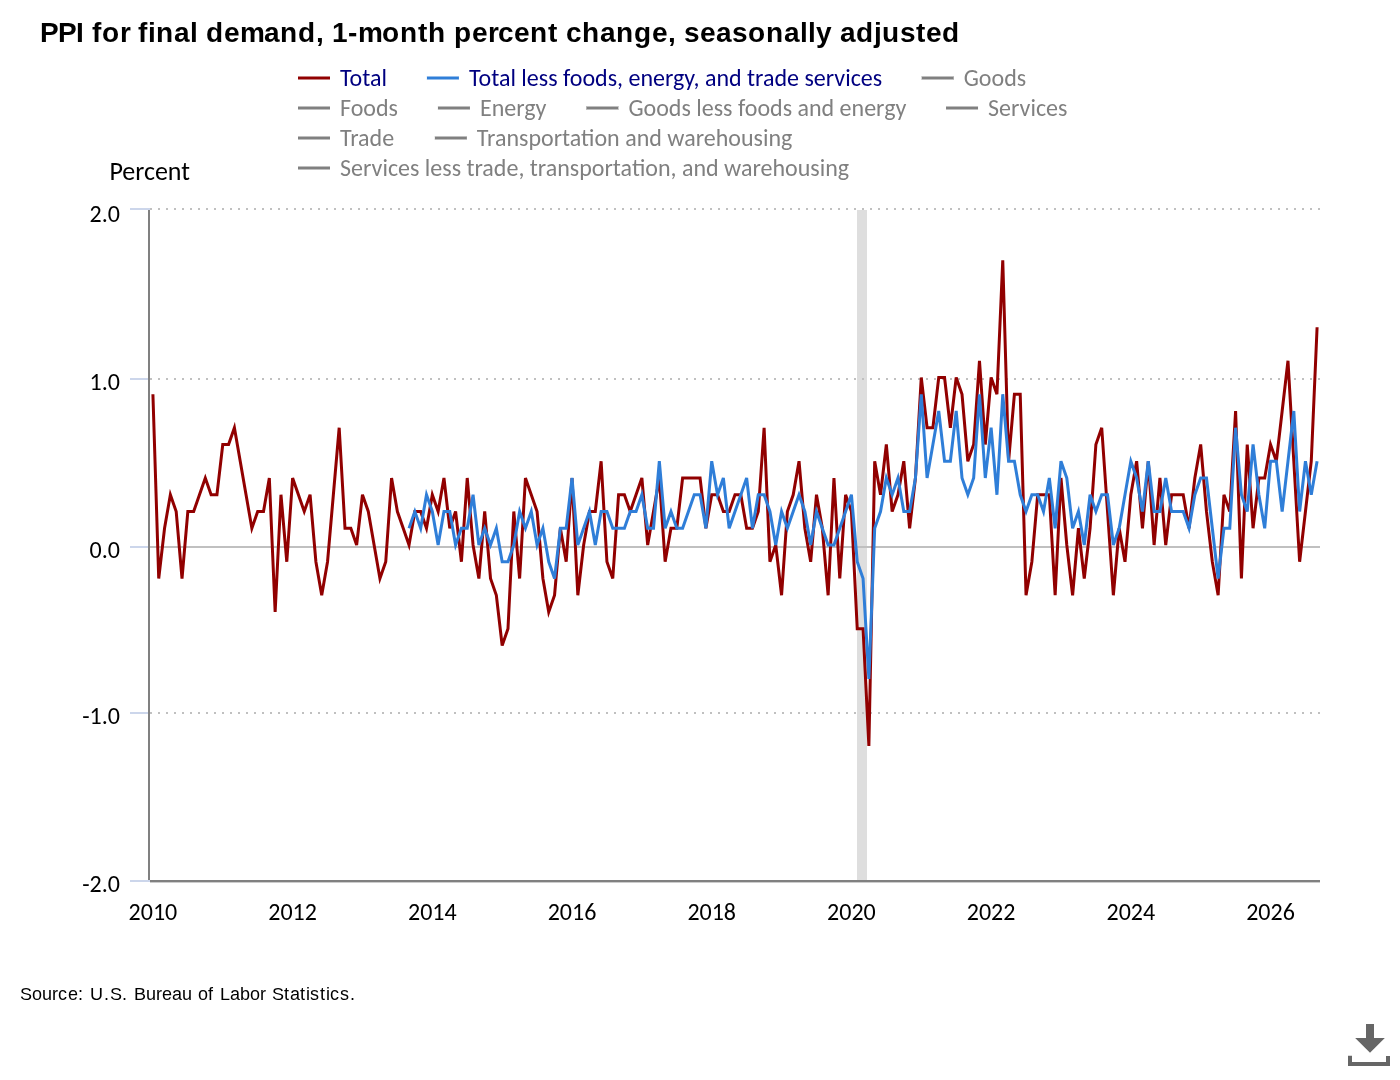
According to official figures released by the Bureau of Labor Statistics (BLS), the September Producer Price Index came in at 6.3%, landing a full 100 basis points higher than anticipated market forecasts. Meanwhile, core PPI climbed to 5.0%, outpacing the expected 4.4% projection.
An official news release from the BLS confirmed the severity of the surge, noting that the September increase represents the largest monthly advance since the index rose 1.7% in March 2022. On an unadjusted basis, the final demand index climbed 6.3% for the 12-month period ending in September, marking the largest annual increase since the index advanced 6.4% in December 2022.
The hotter-than-expected producer inflation data arrived hot on the heels of Consumer Price Index (CPI) figures, which also overshot economist estimates and triggered widespread declines across crypto and traditional risk assets. This macroeconomic headwind arrived while risk assets were already absorbing severe pressure from an international tech sell-off. The contagion was particularly acute in South Korea, where the KOSPI Composite Index suffered a sharp 7.5% drop on Thursday, marking its lowest close since April.
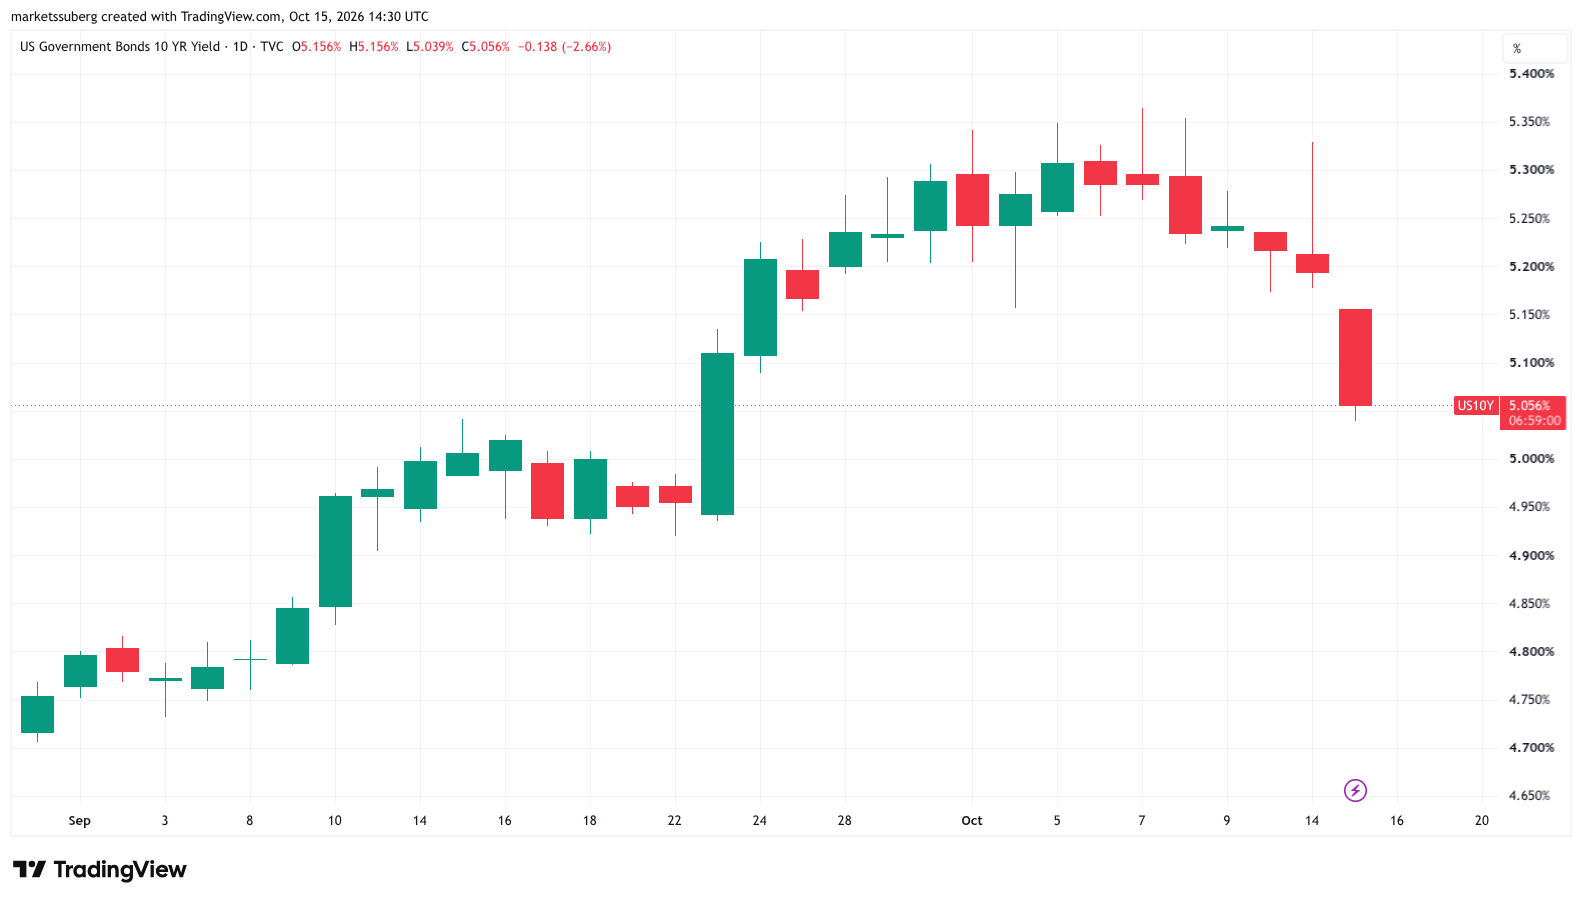
Prominent economist Mohamed El-Erian described the latest PPI report as "even more striking" than the consumer inflation outcome. Despite the elevated inflation metrics, financial observers noted a peculiar market divergence: US bond yields were not following the traditional playbook of rising alongside higher inflation data. At the time of writing, the US 10-year Treasury bond yield dropped by nearly 3%, hitting its lowest level since September 23.
Robin Brooks, the former chief FX strategist at Goldman Sachs, weighed in on the anomaly, pointing to earlier findings that suggested yields had effectively "decoupled" from US macroeconomic data. Brooks argued that market priorities have shifted away from traditional inflation hedging toward heightened anxiety over the federal government’s handling of the budget deficit.
Comparing the 30-day correlation between upside economic data surprises and daily movements in the 10-year yield, Brooks revealed that the metric plummeted from nearly 0.6 earlier in 2026 to just below zero by the end of August. He explained that this structural shift indicates yields are reacting independently of incoming data because market participants are increasingly focused on the long-term trajectory of the national deficit, pushing up longer-term yields regardless of what inflation surprises dictate.
Analysis Eyes "Early-Stage Bull Market" Support Retest
As macro conditions rattled traditional and digital markets alike, Bitcoin’s recent price action brought two critical moving average support trend lines back into sharp focus: the 21-week and 50-week exponential moving averages (EMA), sitting at $76,144 and $78,459, respectively.
Prominent trader and analyst Rekt Capital suggested that despite the sudden volatility, BTC/USD could still retest both moving averages while successfully preserving its overarching bullish market structure. Historically, deviating below these key technical levels during a volatile pullback to find a market bottom is a phenomenon characteristic of early-stage bull markets. However, Rekt Capital noted that while these deviations typically occur after a bullish crossover of the two respective EMAs, Bitcoin remains in a pre-crossover phase.
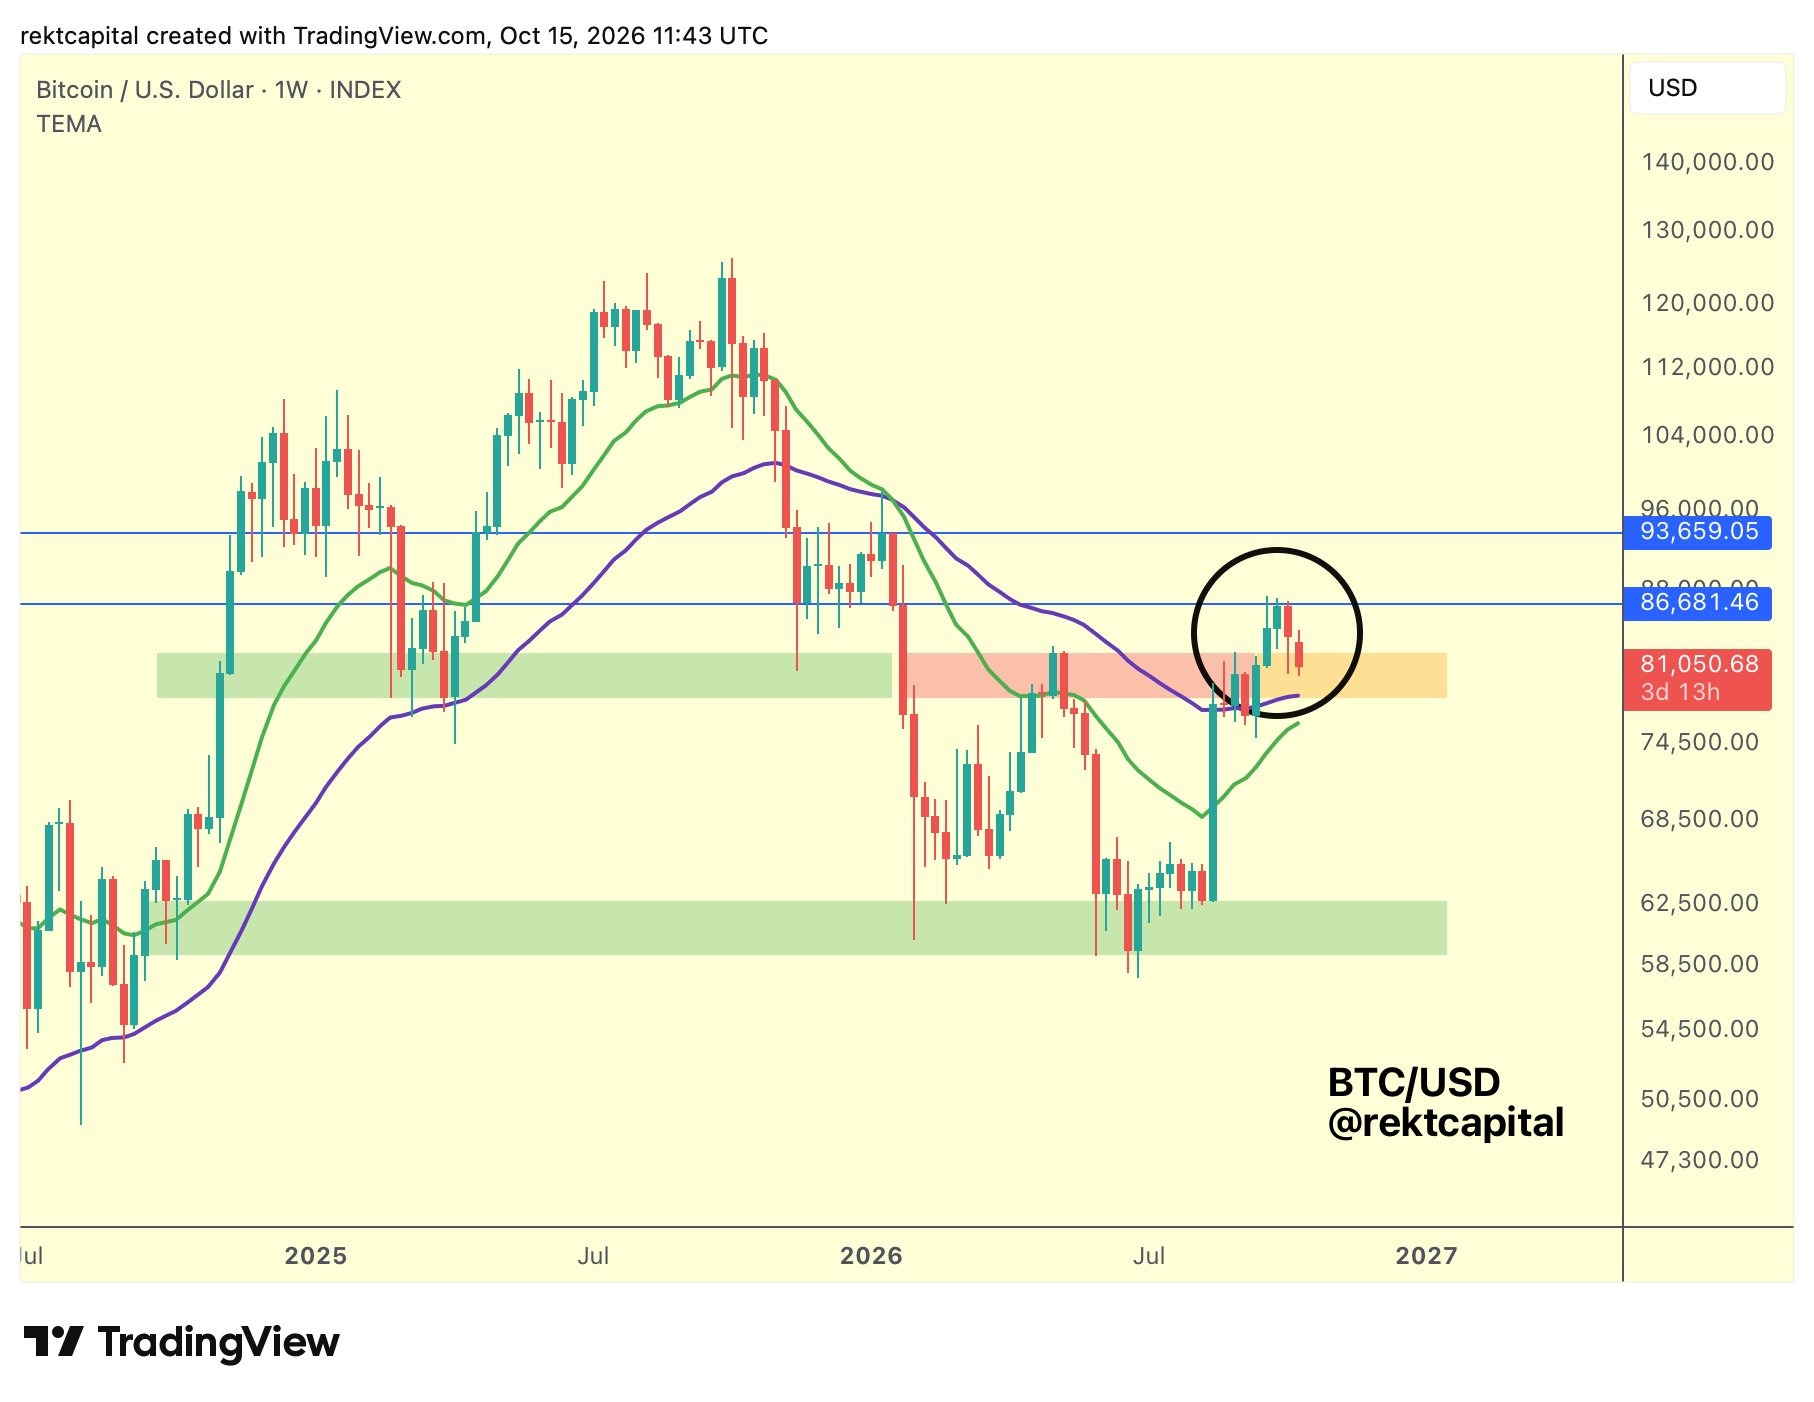
In the immediate term, Bitcoin has continued to trade below the crucial supply and demand zone between $82,500 and $82,800, which has served as a primary area of interest and liquidity for market speculators over recent weeks.
Adding to the technical perspective, analyst Aksel Kibar argued that Bitcoin’s latest weekly close of around $83,700 lacked the structural momentum required to confirm a genuine breakout. Kibar warned that a weekly close inside the established trading range could easily pave the way for a resumption of wide consolidation between the $60,000 and $82,800 levels, with the $75,000 mark acting as the negation level for the rectangle bottom reversal pattern.