
Bitcoin is currently attempting to break through a crucial "inflection frontier" that has historically served as the launching pad for dramatic runs toward new macroeconomic highs. Following a grueling period of market consolidation and macro headwinds, the world’s leading cryptocurrency is once again locking horns with a heavily watched technical trend line that could dictate the trajectory of its next major market phase.
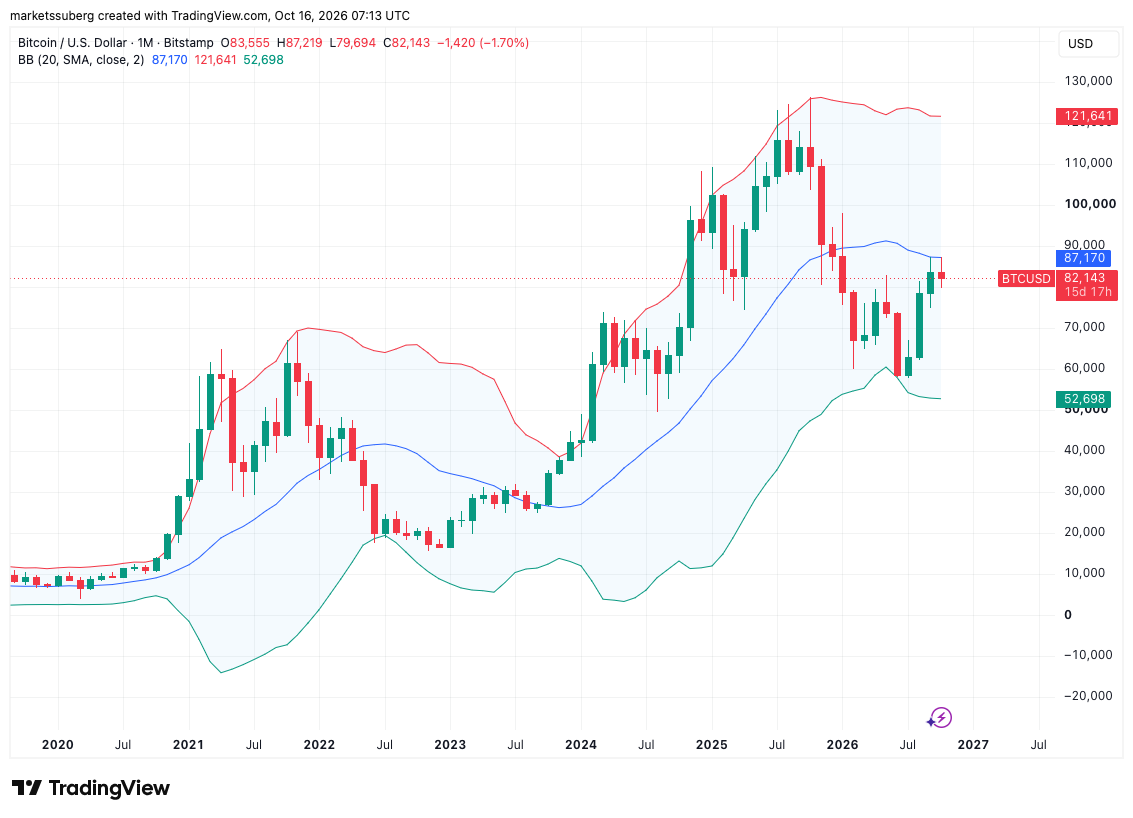
Fresh onchain data compiled by prominent analytics platform CryptoQuant indicates that BTC/USD has embarked on a renewed battle with its 20-month simple moving average (SMA). As of mid-October, this pivotal trend line stands at $87,165. The 20-month SMA is far from an arbitrary moving average; it forms the mathematical foundation around which the popular Bollinger Bands metric is constructed. In turn, these bands establish the basis for CryptoQuant’s proprietary market cycle signals tool, an analytical indicator designed to pinpoint precisely where Bitcoin sits within its broader, multi-year market cycle.
The Bollinger Bands utilize standard deviation to plot an upper and lower band dynamically around the central 20-month SMA. Currently, the upper band hovers around $121,640, while the lower band rests at $52,694. CryptoQuant’s analytical framework defines the territory sandwiched between the lower band and the 20-month SMA as an "accumulation base"—a zone historically favored by long-term holders and institutional investors looking to build inventory during periods of widespread market apathy. Meanwhile, the 20-month SMA itself is designated as the "inflection frontier." This level previously acted as a sharp point of investor capitulation when prices dramatically broke downward from above, most notably during the market shifts seen in late 2025.
With Bitcoin now aggressively preparing to challenge this historical capitulation zone from underneath, historical precedent suggests that a successful, sustained breakout could pave the way for an explosive continuation toward unprecedented cycle highs.

Market observers note that the timeline of this current price action aligns neatly with historical recovery patterns. Writing in a recent CryptoQuant QuickTake blog post, platform contributor GugaOnChain summarized the broader macroeconomic and technical landscape, noting that just over a year after Bitcoin notched its all-time high of $124,709 on October 6, 2025, the overarching market has successfully concluded its systemic "reset."
While classic technical analysts understand that Bollinger Bands are primarily volatility indicators rather than direct buy-and-sell oscillators, CryptoQuant’s specialized market cycle signals view things through a behavioral lens. According to the data, "smart money" entities typically begin systematically taking profits once BTC/USD reaches its upper band. Although the upper band currently sits just below Bitcoin’s most recent all-time high of $126,200 recorded in October 2025, the platform’s cycle signals project that the upcoming bullish wave has the fundamental momentum to push well beyond those previous boundaries.
Addressing the retail sentiment surrounding recent price action, GugaOnChain pointed out a stark disconnect between market veterans and everyday traders. While retail investors frequently experience panic during localized pullbacks—fearing that current price levels around $82,442 represent a definitive cycle top—the underlying onchain indicators suggest the broader market structure is merely warming up for its next major phase. This price zone has increasingly solidified into a robust support area, even as broader financial markets react to persistent economic data and shifting monetary policy expectations.
Complicating the immediate technical outlook is the fact that the 20-month SMA shares a powerful confluence with Bitcoin’s opening price level for 2026, which sits at $87,490. This overlapping technical significance significantly reinforces its strength as a formidable overhead resistance level. Market intelligence reports have highlighted substantial walls of ask liquidity clustered tightly around these zones across major cryptocurrency exchange order books, creating a temporary ceiling that buyers must absorb before a decisive breakout can materialize.
Onchain Data Confirms Entrenching Bitcoin Bull Market
Despite the myriad macroeconomic pressures, regulatory crosscurrents, and risk-off sentiment that frequently buffet both traditional and digital asset markets, CryptoQuant’s analytical division maintains a broadly optimistic outlook regarding Bitcoin’s emerging bull market structure. Analysts continue to parse through a wide array of transactional and network data to evaluate whether the broader market environment supports sustained upward momentum through the final stretch of the year.
Earlier in the autumn, contributors from XWIN Research Japan spotlighted a convergence of three distinct onchain metrics, arguing that the underlying network activity offered solid grounds for cautious optimism regarding a return of robust bullish momentum. These metrics track capital flows, realized capitalization, and long-term holder supply dynamics, painting a picture of a market quietly absorbing sell pressure rather than succumbing to structural distribution.
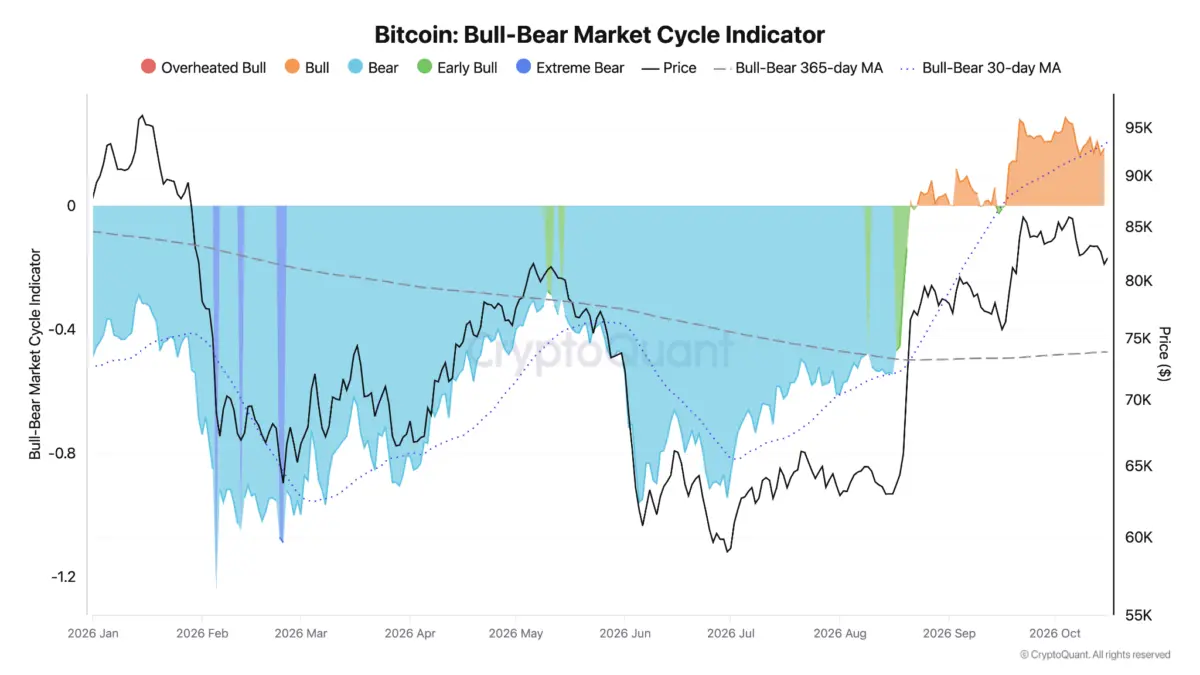
This foundational optimism echoes statements made earlier in the cycle. In late August, CryptoQuant CEO Ki Young Ju formally declared that the macro bear market was definitively "over," basing his assessment on readings generated by the platform’s proprietary bull-bear market cycle indicator. This composite index synthesizes data from several core onchain profitability metrics to gauge the aggregate financial health and sentiment of the network’s participants.
Recent readings from the indicator show bullish momentum accelerating markedly. The metric currently registers a reading of 0.186 on its standardized scale, marking a substantial recovery from the subdued 0.042 reading recorded back in August. This steady expansion in network-wide profitability and onchain momentum underscores the argument that underlying demand remains robust, even as spot prices navigate the complex technical friction presented by the 20-month moving average and associated liquidity walls.
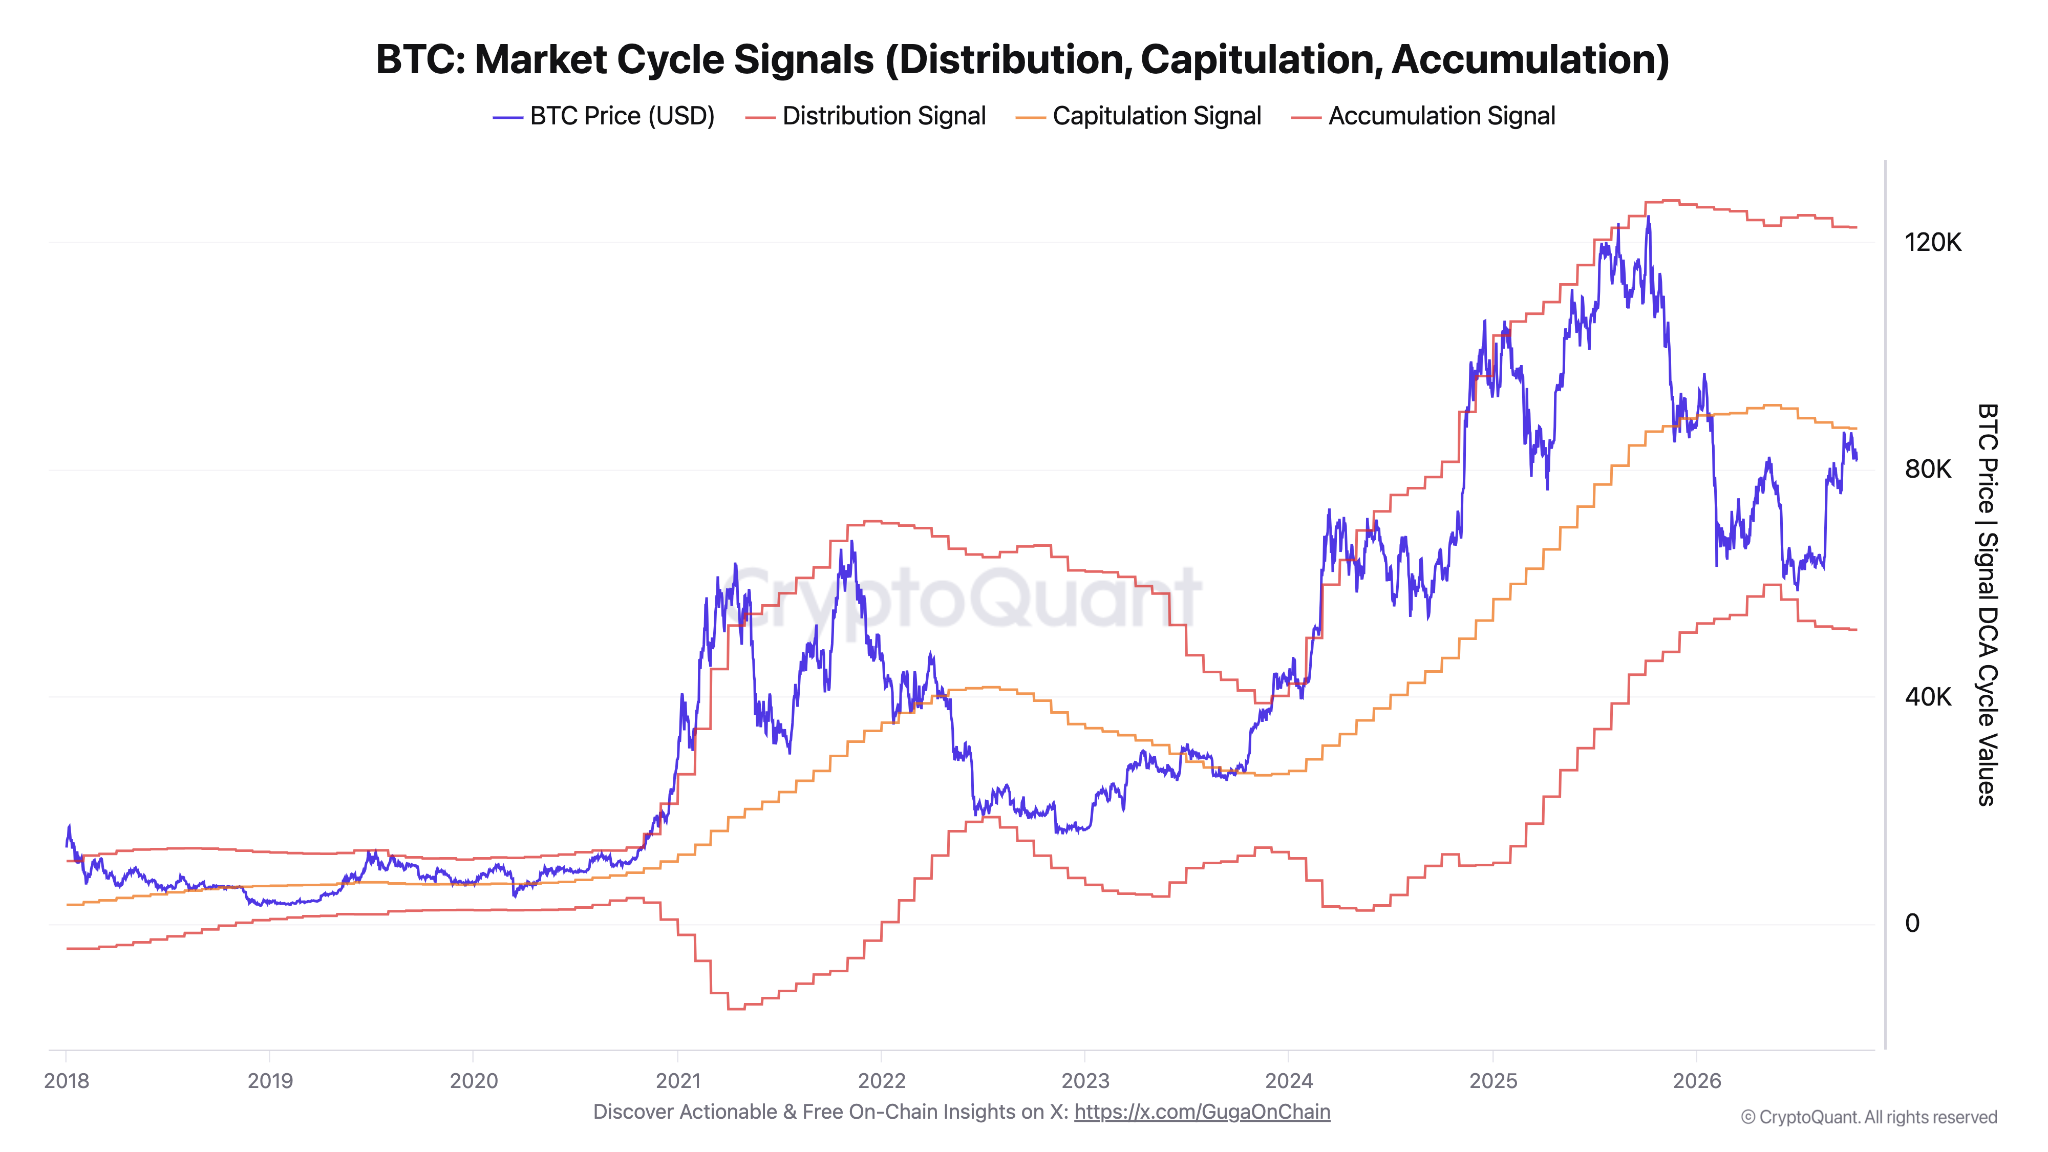
As Bitcoin continues its methodical pressure against the inflection frontier, market participants remain focused on whether spot buyers can generate the sustained volume necessary to flip this multi-month resistance back into macro support. With onchain metrics pointing to a completed market reset and institutional accumulation remaining steady underneath the surface, the coming weeks may well determine whether Bitcoin is poised to validate its historical cycle patterns and set its sights on uncharted territory.